
As I discussed in a previous essay Is 2°C a big deal?, we know that as the world warms the chance of extreme weather events will increase markedly. This essay does not revisit that established insight, but is more of a diversion, exploring simple probabilities.
Attribution studies can now routinely provide estimates of how much more probable a particular event has been made as a result of man-made global warming. The World Weather Attribution organisation provides many example.
There will be impacts on the environment, society and agriculture. Focusing on the latter, sceptics might say, “ok, the chances are increasing, but if we have a crop failure in one region, one year, we have many regions able to compensate.”
The follow up question that comes to my mind is “if I accept that point the question is then how often will we have multiple failures in a given year?”.
There can be some big surprises when one explores probabilities. Bear with me as a tease out a few insights.
A famous example of surprising odds
Imagine there is a public meeting and people arrive one to one. Assume they have random birthdays and we exclude siblings. The question is: how many people need to arrive before the chance of two of the people present having a greater than evens chance of having the same birthday?
What number do you expect? Think about it.
To answer this it’s easier to start by determining the chance for each arrival to NOT have the same birthday. The 1st arrival has 365 choices out of 365. The 2nd arrival has 364 choices out of 365 to avoid having the same birthday. The 3rd arrival has 363 choices out of 365 to avoid a clash. And so on.
So the probability for 3 arrivals not having the same birthday is (365/365) x (364/365) x (363/365) which equals 0.9918 (rounded). So the chance that at least two of these three having the same birthday must be 1 minus this, which equals 0.0092 – see Note [1]. This is pretty small; about a 1% chance.
If you keep repeating this process, surprisingly one finds we only need 23 people to arrive for the chance of two matching birthdays to be greater than even (ie. greater than 0.5). See table in Note [2].
As you can see from the table, for 10 arrivals the chance of a match is just under 1 in 10 (0.1), but then rapidly escalates.
Calculating the chance of extreme weather events without global warming
By extreme weather events I’m not talking even about the current serious flooding in the UK. I’m talking about an event that would take out the arable sector in a large area.
To make this simple and purely as an illustration, I will take the 1,400 million hectares of arable land globally and break this down into 100 blocks, each of 14 million hectares.
Since the UK has 13 million hectares of arable land, the world figure can be thought of as about 100 UKs (of arable land only).
If the chance of an extreme weather event anywhere across the world between 1900 and 1950 was on average 1 in 1000 per year, that in effect defines what level of event we mean by ‘extreme’ for this illustration.
Then, we need to ask the question: what would have been the chance of 2 extreme events occurring in any one year? What about 3?
Let’s first follow a similar but adapted method as with the birthdays.
The chance of NOT having an extreme weather event in the first block is 1 minus (1/1000), which equals 0.999.
Now, the probabilities for each block are assumed to be independent, so the chance of NOT having an extreme weather event in any one year in all blocks is 0.999 x 0.999 x … x 0.999 (with 100 factors), and this equals 0.90479. So a 90% chance of not having an extreme weather event in any of the 100 blocks.
So the chance of having at least one extreme event in any one year across the 100 blocks would be one minus this figure, so that = 1 – 0.90479 = 0.09521 = 0.1 approx, or 1 in 10, or 10%. This is not insignificant. It means that a 1 in 1000 year event will happen once every 10 years somewhere on the planet.
In the next section I’ll use the percentage form, rounded to 2 significant figures to express the odds.
We have gone from a 1 in 1000 chance of an extreme event in one block in one year, to a 1 in 10 chance of at least one extreme weather event across the 100. A simpler way to see this is the 100 x (1/1000) = 1/10.
Moving to multiple extreme event is not so simple.
The basic idea is to visualise the 100 blocks as containers, and the chance of an extreme event as a ball that can be put into a container to indicate an extreme weather event has happened there.
Then, calculating the odds becomes an exercise in counting all possible permutations.
If there were 2 events in one year, then they could be in the same block (and there are 100 ways for that to happen), or in different blocks (and the chances of that are a little more complex to calculate). In general, we need to work out the odds of how you sort X objects amongst 100 containers. We do that using something called a ‘binomial expansion’ – see Note [3] if you want to dive into the details.
We can then look at what happens when the chance of any single event changes due to global warming changes from odds on 1 in a 1000 to say 1 in a 100.
The chance of extreme weather events with global warming
To explore the impact of global warming on the change odds, I have used a progression as follows. The average chance of an extreme weather event in any one year, in any one block, was 1 in 1000 but as the world warms it might become a 1 in 100 year event, or worse a 1 in 50 year event, or worse still a 1 in 25 year event. In Note [4] there are details on calculating the odds for up to 10 events per year across the 100 blocks.
The odds for a single event are already changing. The 40C weather we had in the UK would have been virtually impossible without man-made global warming. But the purpose of this essay is not to make projections or estimates, but simply to illustrate the surprising change in odds that occurs when multiple events are involved.
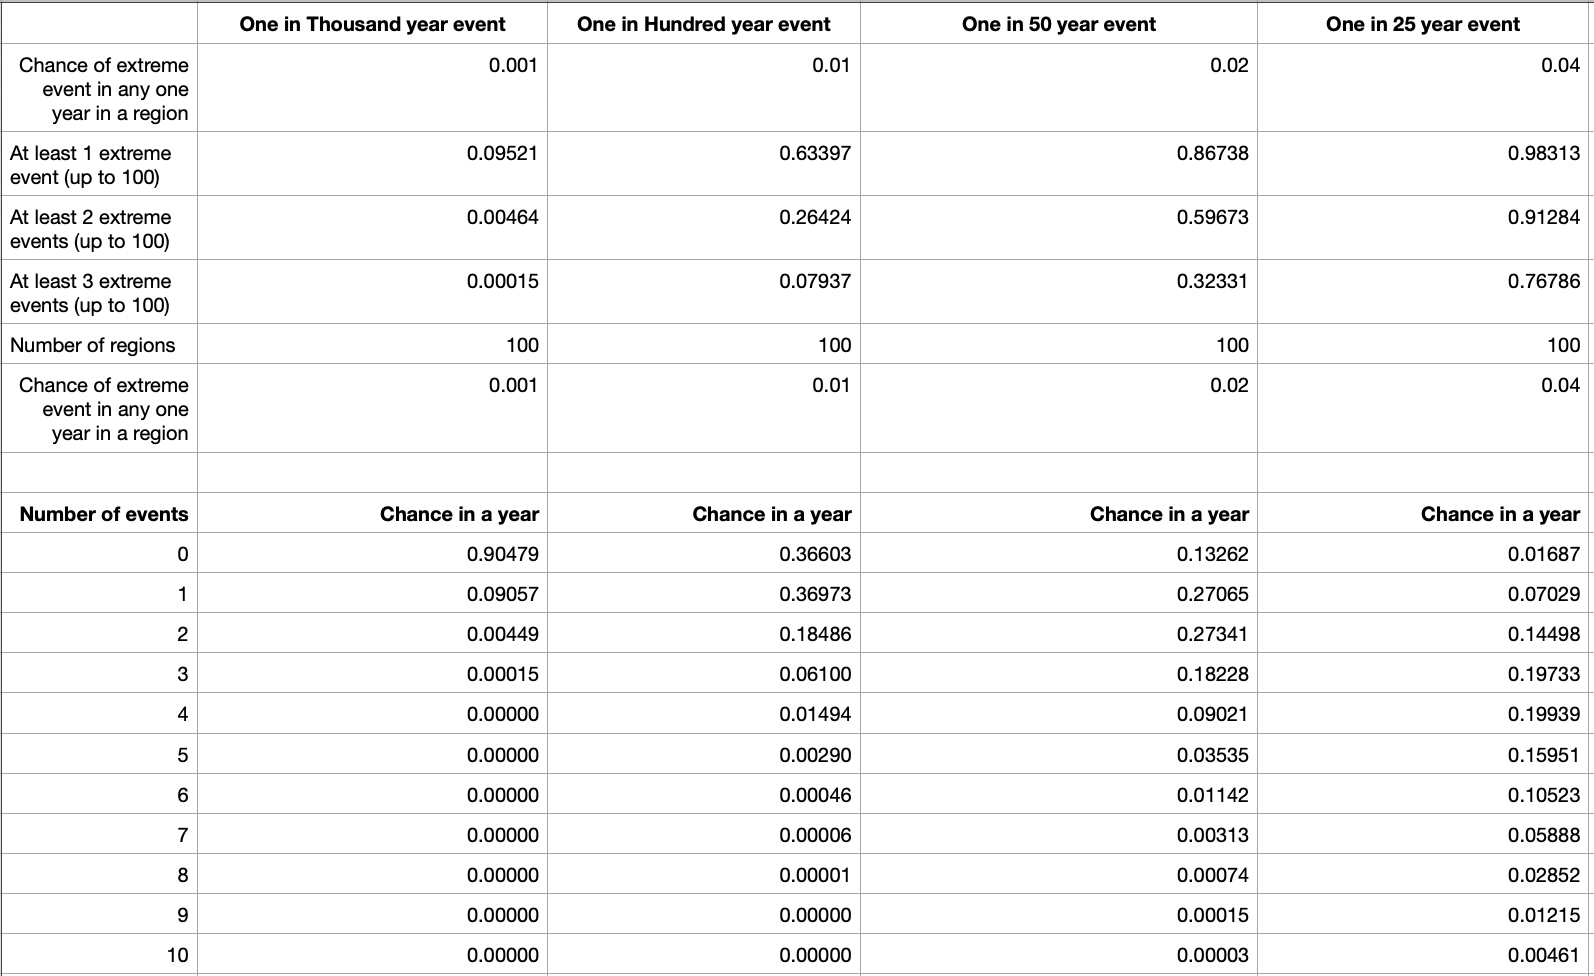
Here is a summary of how the odds change in our illustrative example:

We see that in the warmest scenario (1 in 25), an extreme weather event is likely to happen every year somewhere in the world (98%), but there is a high probability (77%) of there being 3 events occurring in a single year across the world.
If we have 2 or 3 blocks in the world suffering from extreme weather events and consequent crop failures, then that starts to have a major impact on food supply, which is potentially catastrophic.
What is worrying is how the odds of multiple events can escalate quite fast.
So if you have the feeling that more than one extreme event seem to be occurring every year around the world – more frequently than they were a few decades ago – you are not wrong.
(c) Richard Erskine, 2024
————————————— o o O o o ——————————————
NOTES
These notes are only included for those that wish to check my workings. Thanks in advance for spotting any errors. If you are not interested in the details, you don’t need to read these notes.
[1] The one minus trick
If you pick a card from a normal deck of cars, the chance of pulling an ace of spades is 1 in 52. As a number that equals 0.01923, it’s probability. But there is 100% chance (a probability of 1) of pulling a card, so one can say the chance of NOT pulling the ace of spades is 1 – 0.01923 = 0.98077 (which is also what you get from the fraction 51/52).
If a probability of an outcome is difficult to calculate it can sometimes be easier to calculate the probability of not having the outcome, and then using the ‘one minus …’ trick.
So we want the chance of at least one extreme event across 100 blocks. We could try to calculate the chance for 1 event, the chance for 2, then 3, all the way up to 100. The trick is instead to calculate the probability of there being no event across all 100 blocks. Then by taking the resulting probability from one, we get the probability of at least one event occurring.
[2] A famous example of surprising odds
Table calculating the odds:

The Product is the calculated by multiplying the successive A/B values. So for 4 arrivals the Product = 1 x 0.9973 x 0.9945 x 0.9918 = 0.9836 is the probability that none have the same birthday. So the chance of at least two having the same birthday for 4 arrivals = 1 – 0.9836 = 0.0164
[3] Use of the binomial expansion
Let’s assume that the probability of a loss of crops due to an extreme weather event in any one year for any region (because of many possible direct or indirect effects: extended heat wave; flooding; inability to work outside; migration; war) is p, then:
The chance of there NOT being an extreme event in one specific region in any one year is (1-p)
The chance of there NOT being an extreme event ANYWHERE in the world (for all n blocks) in any one year is (1-p) raised to the power n, which is written (1-p)n
Therefore, the chance of there being at least one extreme event (ie. 1, or 2, or 3, etc.) anywhere in the world, in any one year is 1-(1-p)n
The probability of exactly k out of n regions being hit by an extreme weather event in any one year is trickier to calculate but can be done using the binomial expansion:
P(k,n) = ( n!/ (k!(n-k)! ) * pk * (1-p)n-k
To create a table it is convenient to use a generator (especially if n gets very large, as some spreadsheets will blow up or truncate numbers in an unhelpful way), so, we start with P(1,n):
P(1,n) = n * p * (1-p)n-1
P(2,n) = ((n * (n-1)) / 2) * p2 * (1-p)n-2
and in general there is the way to calculate the next number based on the previous one:
P(m+1,n) = P(m,n) * ((n-m)/(m+1)) * p / (1-p)
This is the formula used in the Table (see Note [4]) for P(2,100), P(3,100), etc.
eg.
P (2,n) = P(1,n) * ((n-1)/(2) * p / (1-p)
The sum of P(i,n) from i = 0 to n must be 1
For n=100, the chance of at least 1 event would be P(1,100) + P(2,100) + … + P(100,100).
The chance of at least 2 events would be P(2,100) + P(3,100) + … + P(100,100).
And so on.
[4] Table of probabilities based on binomial expansion
END
