
First posted 2021. Note [12] added 19th July 2023. Doesn’t change the argument and evidence for increased risk of extreme events as global / regional average temperature increases, but adds nuance to Hansen’s claim of fattening of the tail
Alok Sharma, President for COP 26, told a recent meeting:
“Every fraction of a degree makes a difference”
Reported by Shaun Spiers, Executive Director of Green Alliance UK, on Twitter (@ShaunSpiers1, 5th October 2021.
Alok Sharma talked powerfully of the real impact of climate change across the world. Richer countries have a moral duty to act, and it’s in their self interest.
Roger Harrabin, the BBC’s Energy & Environment Analyst since 2004, responded:
“This is such a hard concept to get across. @AlokSharma_RDG is right – every fraction of a degree really does matter. But how to you explain that to the public who may not even take off a layer of clothing for two degrees?”
I would direct Roger and anyone else seeking an answer to Katharine Hayhoe, who is the supreme master of communication on such questions. Her short video “What’s the Big Deal With a Few Degrees?” answered the question in a very accessible way.
1°C is already big deal
As Katharine Hayhoe concludes, the Earth is already “running a temperature”, and on Twitter said:
“Using our body temperature is one simple and surprisingly relevant analogy. A fever of 2°C has significant, noticeable, and if sustained long-term, dangerous impacts on our health & well-being.”
The Earth System is very complex, and so is the human body. Part of this wonderful complexity is the ability to self regulate. Under normal conditions this manifests itself as a stable system in dynamic equilibrium, albeit with minor variations and cycles (such as the seasons and mentrual cycles).
Since the end of the last ice age, the concentration of carbon dioxide in the atmosphere, and hence the global averaged temperature of Earth (not to be confused with weather), has remained remarkably stable, despite large flows of carbon associated with the carbon cycle (which tend to cancel each other out). Human civilisation and its agriculture have emerged over 10,000 years, benefiting from this largely stable climate.
Human emissions since the industrial revolution about 200 years ago have now increased carbon dioxide concentrations in the atmosphere by 1/3rd from 280 parts per million to 414 ppm [1]. This is level is more than at any time in the last 2 million years [2].
This is already causing a major disruption in the delicate balance that has existed in pre-industrial times, and we are already seeing the impacts in the increasing frequency and severity of extreme weather events. Each fraction of a degree is important in limiting the damage.
To explain what seems at first to be such a surprising consequence from such a small change is important to realise a few things:
- the land on Earth is under 30% of the total surface area, and the ocean’s temperature is moderated by the heat capacity of a large volume of water, so land is proportionally more affected.
- as was predicted in 1967 [3], there is proportionally more warming as you move towards the poles. This not only warms high latitude regions, but disrupts the jet streams that help drive weather patterns at lower latitudes.
- the rises in temperature are not evenly spread around the world and in a cruel twist, many regions which are the poorest and least responsible for emissions will face the worst impacts.
- a shift in the averaged temperature hides a massive increase in the chance of weather extremes.
- at both extremes of the hydrological cycle (dry regions and wet regions) there is a tendency to magnify these extremes (dry regions get drier, wet regions wetter).

Even with ‘just’ a 0.9°C increase (relative to pre-industrial, this is a 1.2°C increase) in a global mean surface temperature between the 1951-1980 average, and 2009-2019 average, Hansen and Sako have shown [4]:
- hot summers on land in the Northern Hemisphere already occur twice as often and,
- extremely hot summers (like 2003) already at least 200 times more often
As Katharine Hayhoe explained, a 1°C rise in GMST is an enormous amount of energy.
The difference between a 1.5°C rise and a 2°C rise is highly significant. The IPCC’s 1.5°C Special Report [5] [6] showed a number of ways in which the impacts of 2°C are significantly magnified compared to 1.5°C:
“At 1.5 degrees Celsius warming, about 14 percent of Earth’s population will be exposed to severe heatwaves at least once every five years, while at 2 degrees warming that number jumps to 37 percent.”
Humanity has left it so late to act that avoiding 1.5°C is now well nigh impossible (according to the IPCC), but we can still decide and act to keep below 2°C, and must avoid the increasingly dangerous higher temperatures.
We are warming very fast
Climate change is happening in a mere flick of the fingers on geological timescale.
Going back as far as the emergence of Homo Sapiens less than 300,000 years ago, the rate of increase in carbon dioxide levels has never been this fast, and the global mean surface temperature has never risen this fast.
It got me thinking about how to articulate why the current rate of change is truly unprecedented.
It is important to note that there is usually an initiating cause of a global warming episode in Earth’s deep past – such as orbital changes that provide the drum beat for ice ages, or even earlier, extreme volcanism. But the main cause of the warming has without exception, since life has existed on Earth, been the release of greenhouse gases. These have been principally carbon dioxide and methane released over thousands of years (short on geological timescales).
Our current situation is quite different for 3 reasons:
- The initiating cause and the main cause are one and the same: human caused emissions of carbon dioxide from fossil fuels (3/4 of the problem) and emissions of greenhouse gases from agriculture (1/4 of the problem).
- The period over which this is occurring is an instant in geological terms, just 200 years or so since the start of the industrial revolution,
- whereas for the exit from the last ice age, it took 8,000 years [8]
- another analogue to the current fast warming is the PETM (Paleocene–Eocene Thermal Maximum) with an initial burst of greenhouse gases and warming over a period of between 3,000 and 20,000 years [9]
- Human choices are the ultimate cause, and we can stop it.
Currently we have warmed by about 1.2°C in less than 200 years.
The rate of increase in carbon dioxide concentrations is a useful indicator of risk, because it is the doubling of concentrations that give rise to an increment of warming of about 3°C. Only by stopping emissions can we stop further warming.
The rise in CO2 concentrations averaged over 200 years is 0.67 part-per-million per year (ppm/yr), which is unprecedented. The PETM higher rate of rise of 0.42 ppm/yr comes close, but the exit from the last ice age is much slower, at a rate of 0.01 ppm/yr.
If we continue on the high emissions path we are on, we could reach 4.4°C of warming (3.3°C – 5.7°C range, relative to pre-industrial) [10].
This results from a further increase on carbon dioxide concentrations at a rate of 9 ppm/yr [11], which would far exceed even the upper estimates of the rate of increase during the PETM.
I have summarised all this in the following table.
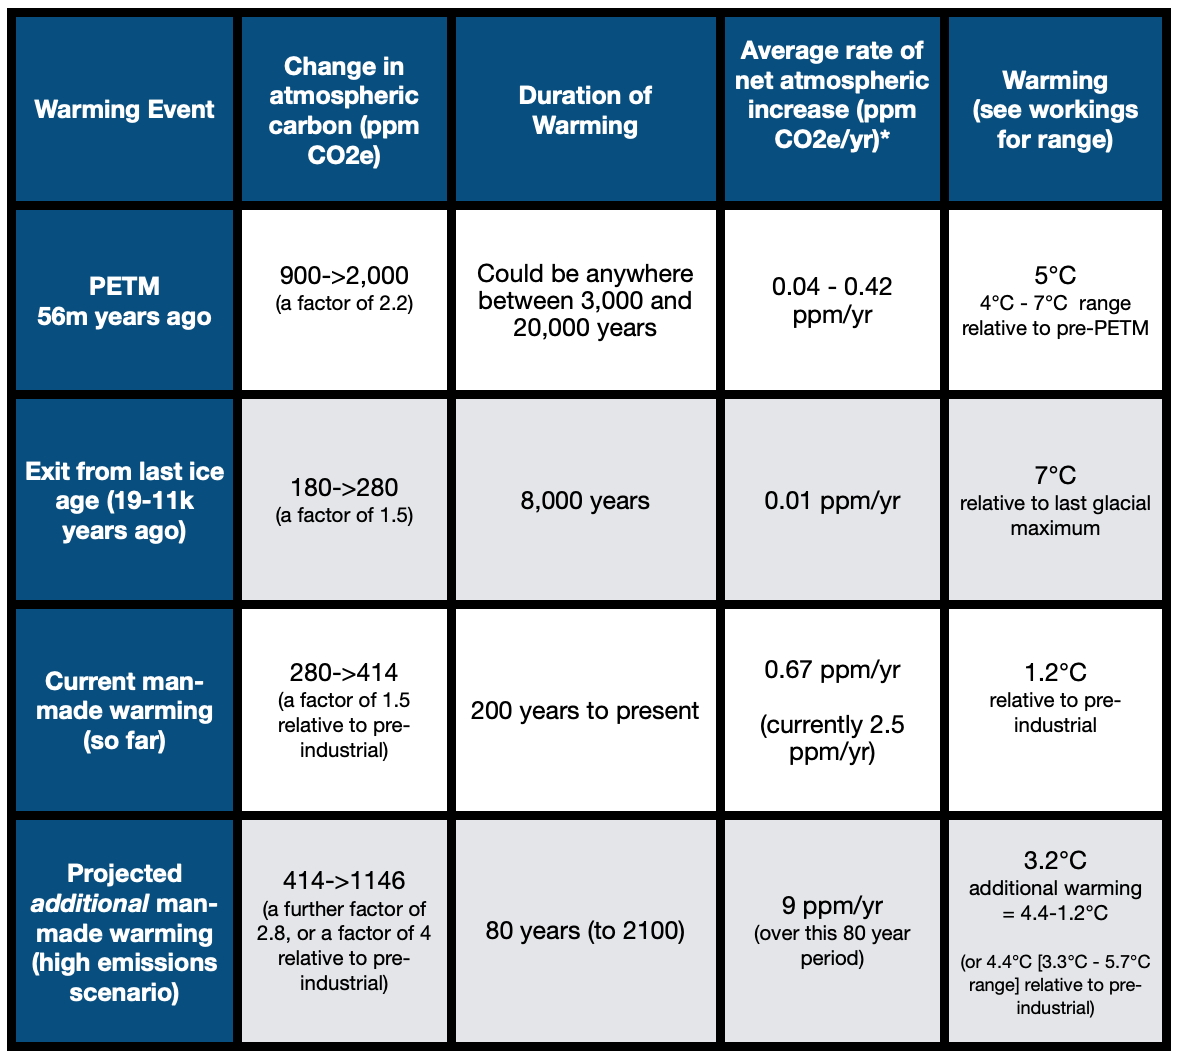
I wonder how anyone can imagine we are not in a climate emergency looking at this table.
(c) Richard W Erskine, 2021.
[correction – I transcribed the wrong numbers from the table to the narrative for duration of PETM pulse – now fixed]
. . . o o O o o . . .
Notes
- See atmospheric Carbon Dioxide (CO2) levels, 1800–present, https://www.sealevel.info/co2.html (original sources NOAA and NASA).
- The IPCC states “In 2019, atmospheric CO2 concentrations were higher than at any time in at least 2 million years” (in Ref. A, section A.2.1)
- Manabe and Wetherald in 1967 published results using the first full model of the greenhouse effect including radiative, convective, and other key aspects, to model the greenhouse effect on earth (Manabe having received a share on the 2021 Nobel Prize in Physics for his contributions)
- James Hansen and Makiko Sato published estimates in 2016 (Ref. B). These have now updated in 2020 in, see http://www.columbia.edu/~jeh1/mailings/2020/20200706_ShiftingBellCurvesUpdated.pdf
- Hansen and Sato use baseline 1951-80, which is 0.3°C above the accepted Pre-industrial baseline. So the 0.9°C of warming to date, is equivalent to 1.2°C relative to pre-industrial.
- See IPCC Reference C, and and useful summary by NASA, Reference D.
- Global Warming of 1.5C, A Special Report by the IPCC https://www.ipcc.ch/sr15/
- During a much earlier period in geological history, about 56 million years ago, when the world was already warm and ice free, there was an event that lead to extremely fast (in geological terms) warming. It is called the Paleocene–Eocene Thermal Maximum (PETM). This is described by the IPCC as follows (Ref. A):
“A geologically rapid, large-magnitude warming event at the start of the Eocene when a large pulse of carbon was released to the ocean-atmosphere system, decreasing ocean pH and oxygen content. Terrestrial plant and animal communities changed composition, and species distributions shifted poleward. Many deep-sea species went extinct and tropical coral reefs diminished.”
- The Last Glacial Maximum was 23-19 thousand years ago (Reg. A). The current period of interglacial temperatures has lasted 10-11 thousand years. I take 19-11=8 thousand years are the period of exit from the last ice age.
- For PETM, numbers taken from IPCC (Ref. A) are: 900->2,000 ppm CO2 (sect 2.2.3.1); 0.04-0.42 ppm CO2/yr(Table 2.1) and estimate of 5°C (4°C – 7°C range) globally averaged warming (sect 2.3.1.1.1). Although a new study (Inglis (2020) suggests greater warming.
- The SSP5-8.5 high emissions scenario gives rise to a warming of 4.4°C [3.3°C – 5.7°C range] relative to pre-industrial by 2100 (see Table SPM.1 in Reference A).
- Box TS.5 in Ref. A indicates SSP6-8.5 would have cumulative emissions of 11,000 GtCO2. But Figure SPM.7 has 38% of these emissions absorbed by ocean and land/biosphere, so 0.62*11,000=6,820 GtCO2 CO2 remains in atmosphere (for a long time). Now Mackay noted “A useful way to calculate things is to remember that 127 part per million (ppm) of CO2 in the atmosphere equates to 1000 GtCO2”, so 6,820 GtCO2 equates to 6.82 * 127 = 866 ppm CO2. We need to add that to the pre-industrial level of 280, giving a total 1146 ppm CO2. Now, dividing this by 80 years (2020 to 2100) gives 9 ppm CO2 per year on average. Note that this case includes high GHG emissions, but also incorporates a reduced level of take up of greenhouse gases in the oceans, land and biosphere (something that many who criticise this scenario as ‘pessimistic’ fail to grasp).
- The question of not whether Hansen is correct in seeing not just a shifting of the distribution (which is undeniable) with increased risk of extreme weather. This may surprise some but is basic statistics, and a long expected result, as shown, for example in the IPCCs 4th Asessment Report (2007) , buried deep in the Technical Summary Box TS.5: Extreme Weather Events. The question is whether Hansen is right in seeing a change in shape of the distribution (fatter tails, or in maths speak, a change in the standard deviation). This was challenged by one author (see Ref. E). However, to reiterate the key point: this doesn’t alter the fact that we will expect an increasing level of extreme weather events as the ‘mean’ temperature increases.
References
A. IPCC, 2021: Summary for Policymakers. In: Climate Change 2021: The Physical Science Basis. Contribution of Working Group I to the Sixth Assessment Report of the Intergovernmental Panel on Climate Change [Masson-Delmotte, V., P. Zhai, A. Pirani, S. L. Connors, C. Péan, S. Berger, N. Caud, Y. Chen, L. Goldfarb, M. I. Gomis, M. Huang, K. Leitzell, E. Lonnoy, J.B.R. Matthews, T. K. Maycock, T. Waterfield, O. Yelekçi, R. Yu and B. Zhou (eds.)]. Cambridge University Press. In Press.
B. James Hansen and Makiko Sato (2016) Environ. Res. Lett. 11 034009
C. Global Warming of 1.5C, A Special Report by the IPCC https://www.ipcc.ch/sr15/
D. Alan Buis, A Degree of Concern: Why Global Temperatures Matter, NASA, 19th June 2019 https://climate.nasa.gov/news/2865/a-degree-of-concern-why-global-temperatures-matter/
E. ‘Increased variability?’, ‘Tamino’, Open Minds blog, https://tamino.wordpress.com/2012/07/21/increased-variability/
. . . o o O o o . . .

Pingback: My Sceptical Friend | EssaysConcerning
Thank you for this summary ! In sharing, french artist, I invite you to discover my series of drawings in progress: “Vanity”, of which the IPCC report is at the origin :
https://1011-art.blogspot.com/p/vanite.html
And in direct link, about biodiversity “La robe de médée” : https://1011-art.blogspot.com/p/la-robe-de-medee.html
LikeLiked by 1 person
Pingback: Why are politicians so blasé about the risks of global warming? | EssaysConcerning
Pingback: Expect the Unexpected | EssaysConcerning
Pingback: Not In His Time | EssaysConcerning