It will surprise many just how much progress the UK has made in lowering its carbon emissions. working towards energy independence and, more importantly, how much progress we can make if we don’t lose focus.
This story is often told by energy geeks using complicated diagrams that I love but are too complicated – I have discovered – for the average citizen. So, when I was asked to give a talk ‘Greening Our Energy: sooner than you think’ for a village community, I strived hard to make the information as accessible as possible. I’ve simplified the presentation to make it accessible to everyone.
This essay is based on a recording I made from a dry run of the talk, so I hope I have retained the conversational style of the talk. I start by creating some Context: why do we need to act?; what is energy?; the ‘Primary Energy Fallacy’; and the history of electrification and heat pumps.
I then get into the main event: Progress towards a UK clean energy future. I look at a picture that has changed dramatically in the passage from 2010, through 2017, to 2023, and I look at the Clean Power 2030 goal.
In Making the transition work for everyone I address the hurdles to fully ‘decarbonising’ the UK economy, specifically the question why is the price of electricity so high in the UK?. I show how transport and heating are low hanging fruit that must be grasped, and explain saving money on heating switching to a heat pump. Then, I show how the electrification of energy end-use might look in 2035 in: Is a Clean Energy ‘Tipping Point’ near?
In The path to 2050 I look at how the final electrified economy would look and at how achievable it really is. Specifically, I focus on long duration storage and the question, what about land use?
Then finally, in A Personal Story, I tell of the electrification journey that my wife and I have been on, with our 200 year old Grade 2 Listed home, which we were told couldn’t be done by so many.
Context
Why do we need to act?
We have records of the central England summer temperature, with readings going back to 1659, averaged1 over a rolling 30 year period to even out all the variability in the weather. It varied by no more than about 0.2°C over 300 years. However, in the last 50 years we’ve seen a rapid rise in this mean summer temperature.
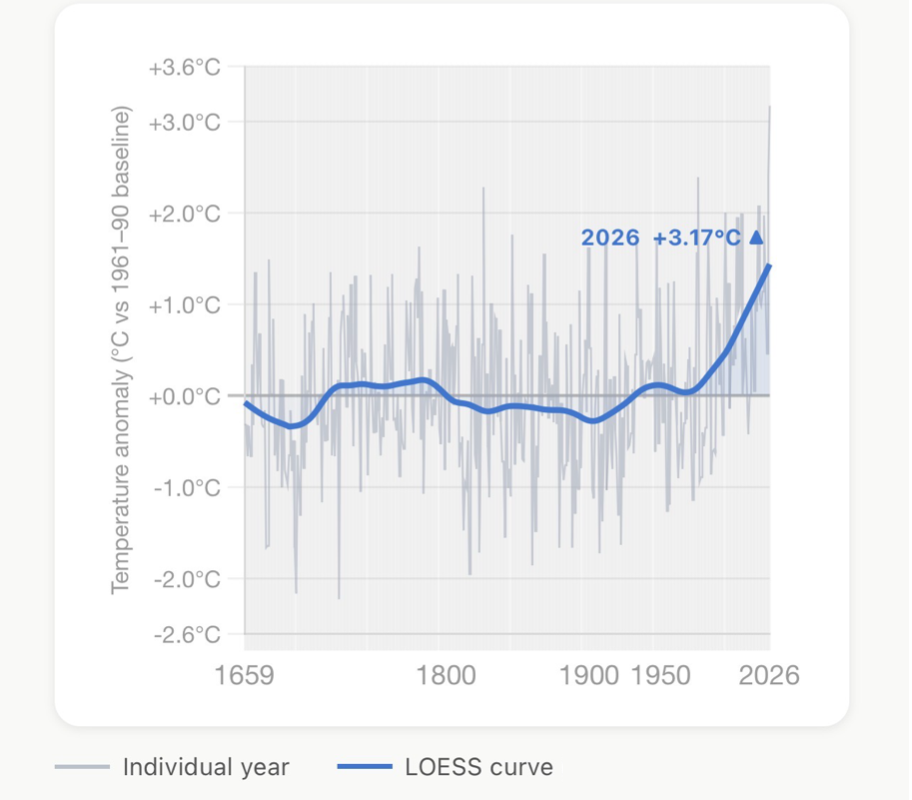
Fig. 1 – Central England Summer Temperature
This year, 2026, the UK has had its hottest summer on record, and that beats the previous record which was last year. The five warmest summers on record have all occurred since 2003, and we know why.
It’s a separate talk, going into the science that has unfolded over 200 years, giving us a clear and unambiguous understanding of man-made global warming. There is no better place to start too understand the history of the science than Spencer Weart’s online book The Discovery of Global Warming2.
As stated3 succinctly by the Intergovernmental Panel on Climate Change in 2021:
“It is unequivocal that human influence has warmed the atmosphere, ocean and land.”
Europe is already in a new climate. Almost every year there is some extreme weather event happening in some country or other – Germany, Greece, UK or wherever – at one end of the hydrological cycle or the other (heatwaves or flooding).
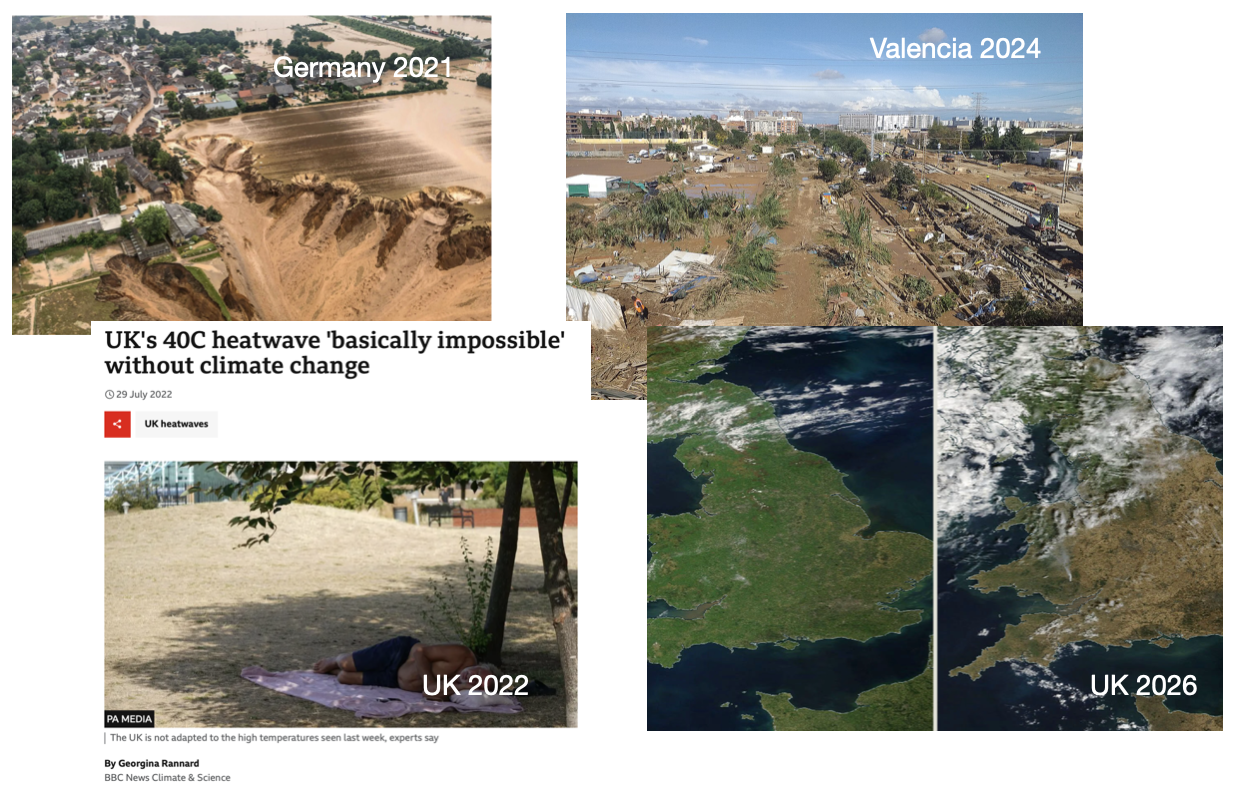
Fig. 2 – Europe is already in a new climate
It’s a bit like throwing loaded dice. You can’t say that every year is going to be worse than the previous year, but we know the odds have changed to make it more likely we will experience extreme weather events. It’s a statistical certainty. that if the probability distribution shifts a little the chances of extremes shift a lot4.
With continuing emissions the climate dice are getting progressively more loaded, and so the odds are getting worse, year on year. Depending on where extreme events happen, when they happen in the season, and how long they last for, that can have huge impacts. Talk to farmers and ecologists to understanding how.
And of course most recently we’ve had the collapse of a glacier in Nepal, with catastrophic consequences, which we can attribute to global warming to a significant extent5.
What is Energy?
Before discussing the positive story of the UK’s energy transition, past, present and future, we need to answer the question: what is energy? Richard Feynman observed6 that it is a very subtle concept and difficult to understand, but I’m going to make it really easy for you.
Energy in our everyday lives can come in many different primary sources – the wind, fossil fuels, nuclear, etc. It is then put to work to do practical things: lift a weight, move a car, heat a room. Generally, when we transform from one kind of energy to another, say from solar to electricity, or from electricity to green hydrogen, there will be losses, and it’s really important to keep account of those losses when considering the economics of different sources and end-uses of energy.
Most of our energy comes from the Sun and that includes fossil fuels because we can think of the plants that were laid down 300 million years ago – having been dependent on the sun for their growth – as bottled sunshine, in the form of fossilised carbon. What we know now, but didn’t at the start of the industrial revolution, is that it was not a good idea to take millions of years of a fossil fuels and burn them in the space of just 200 years, raising the level of the greenhouse gas carbon dioxide in the atmosphere. Now, we have no excuse for continuing to burn this ancient carbon.
If we just take the contemporary Sun hitting the Earth today and look at how much power there is in that that sunlight, it’s something like 10,000 times more than what humanity needs or is ever likely to need [see Note A].
So my challenge to anyone who is sceptical about renewables is this: are you really saying that humanity does not have the ingenuity to harvest the sun’s energy (using the sun’s rays directly, or indirectly in the form of the wind and ambient heat that are produced). Are you saying we don’t have the engineering capabilities to capture, store and use that massive over-abundance of energy from the sun?
More prosaically, we know about energy from our bills, where we see our usage in kilowatt hours (kWh) of gas and electricity – this is the energy that we pay for and is most familiar.
We also know about the power rating of the devices we have in our homes. An old incandescent lightbulb with a power rating of 40 Watts would take 25 hours for it to consume 1 kWh of energy, whereas a 3000 Watt kettle (3 kW) will take 20 minutes to consume 1 kWh. As an aside, it’s much more important to not fill your kettle when making a cuppa than stressing about your TV on standby [see Note B].
For the UK as a whole, currently it’s something like on average 40 Giga Watts (GW) of power demand which is equivalent to 33 million kettles. Multiply that by the number of hours in a year and you get about 350,000 GW hours (GWh), or 350 Tera watt hours (TWh). So those are the big numbers you’ve got to keep in mind when you’re judging what people are saying about renewables and other forms of energy at the scale of the UK. People sometimes confuse power and energy. You need the time element ‘h’ as part of a unit of energy – be it kWh, MWh, GWh or TWh.
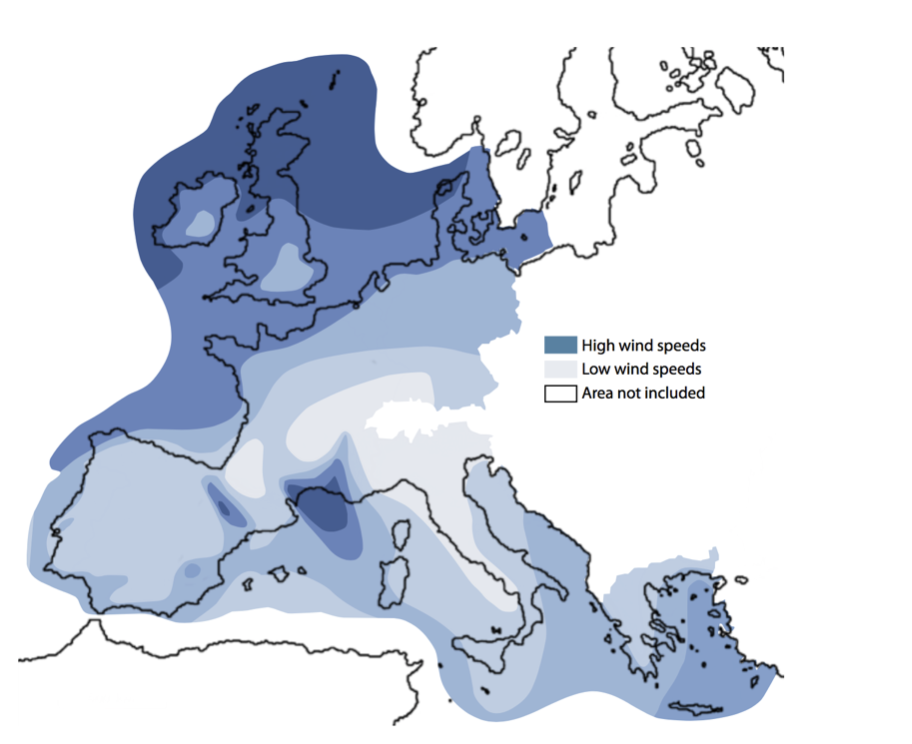
Fig. 3 – UK wind resources (from Zero Carbon Britain7)
The UK is extremely rich in wind resources7. It’s ironic that “Britain was terribly well endowed with coal: when the Revolution started, the amount of carbon sitting in coal under Britain was roughly the same as the amount sitting in oil under Saudi Arabia” as David Mackay observed8. It was that coal that powered the Industrial Revolution in the UK. Now it is wind that will be the leading source of power in the UK’s clean energy revolution.
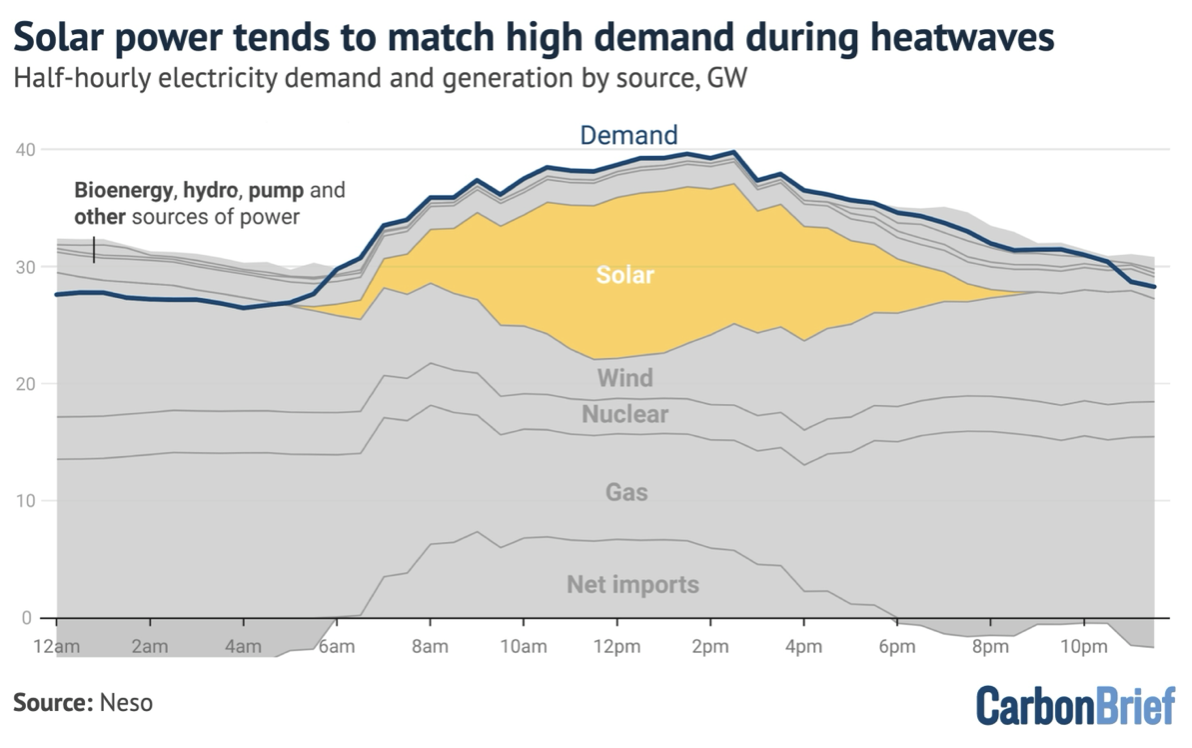
Fig. 4 – Solar Power during Heat Waves9
It’s not only wind. Despite the UK’s high latitude, in our summer the UK is tilted towards the sun, so we get long summer days when the wind tends to be less plentiful. On the 26th of June this year, for example, the electricity demand was not being met by wind, gas and nuclear; when it is very hot, gas turbines produce less power. So it was solar that enabled the grid to meet the demand for power9.
Primary Energy Fallacy
I now need to talk about the ‘Primary Energy Fallacy’, a term coined10 by Paul Martin and since popularised11 by Professor Jan Rosenow. This is incredibly important because a lot of the renewables naysayers fall into the trap. Surprisingly, this is not only from aggressive right wing naysayers, but also some who regard themselves as ‘green’. The issue arises from a failure to acknowledge the fact that most of the energy from burning fuel for energy is waste heat.
For example, if we burn three units of coal to produce electricity, two units of the calorific energy of the coal is wasted as heat and only one is turned into electricity, but we still pay for the original 3 units.
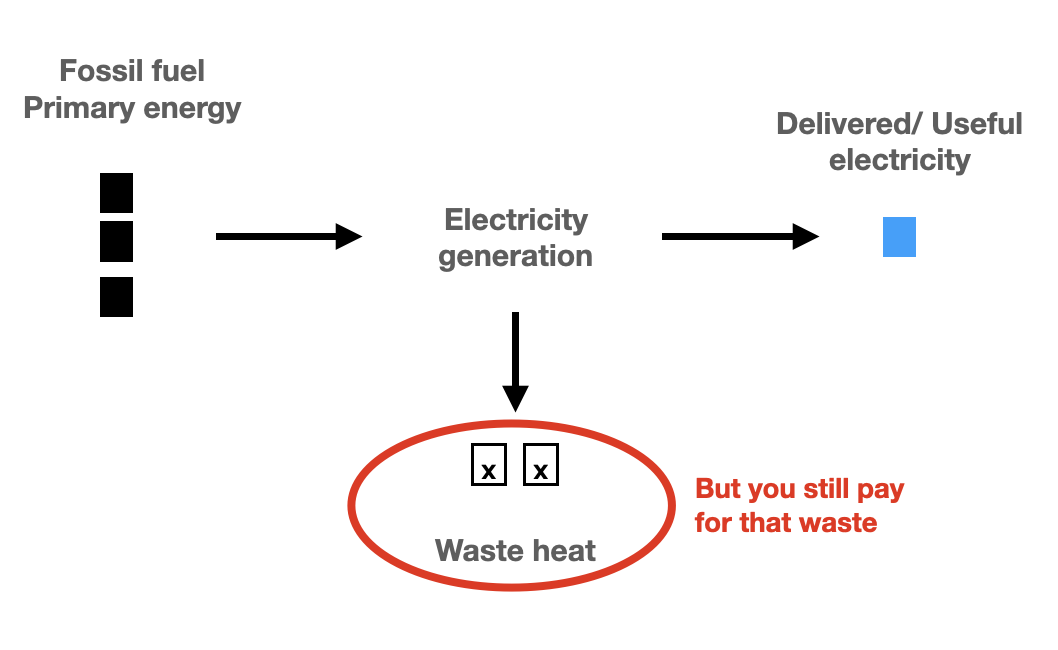
Fig. 5 – Power losses from fossil fuel generation (coal example)
If you look at transport its the same again. The petrol is transported to a petrol station and then goes into the car, but we are wasting two thirds of that energy when we burn it to power the car.
Whereas, when we take energy generated by a wind turbine (where the wind is free) and use the electricity generated in an EV, we get one unit of useful energy for one unit of electricity supplied.
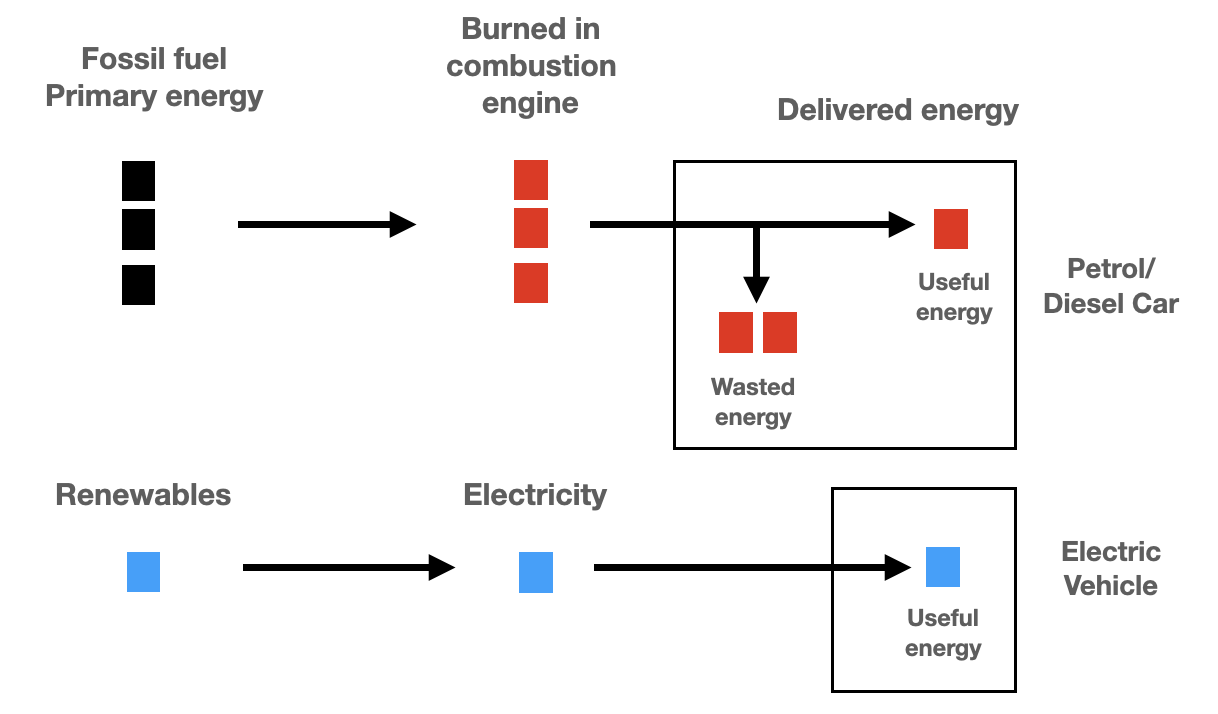
Fig. 6 – EV versus Petrol Car Efficiency
When we come to heating we have a somewhat different source for the relative efficiency gain. After all, heat from burning gas or oil in a boiler is the end product, so not wasted energy in this case. It’s never the 100% efficiency that the picture implies, but it’s simpler to illustrate the argument this way.
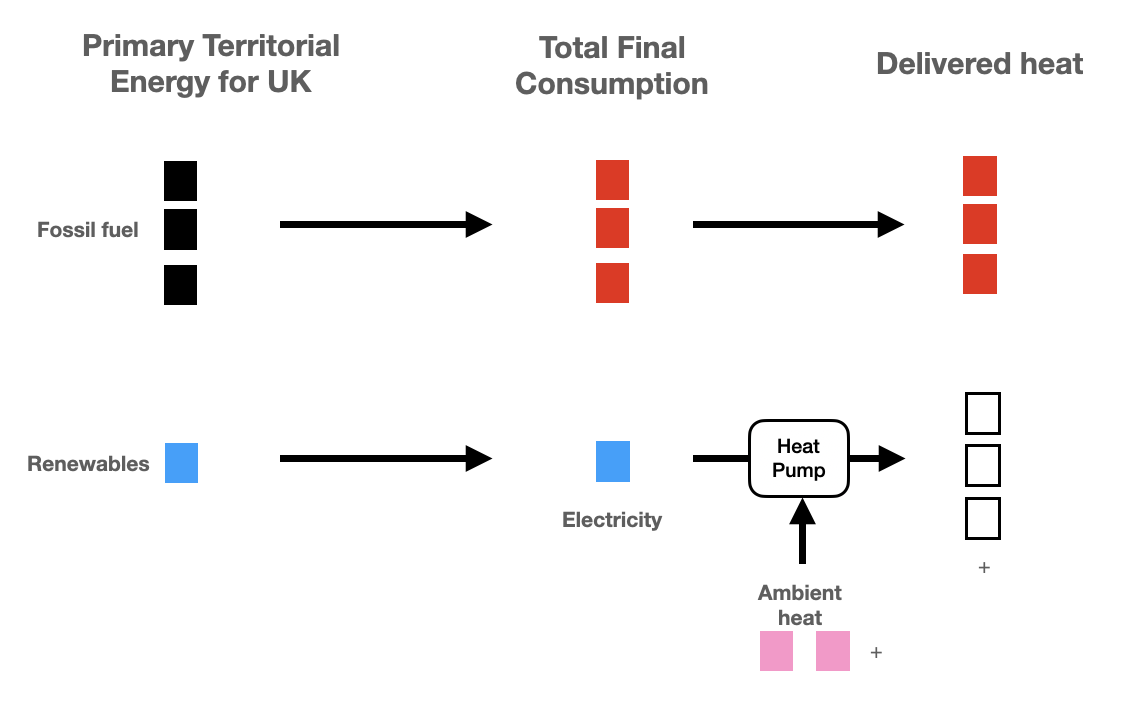
When we use a heat pump it is harvesting ambient or low grade heat from the environment, then concentrating it to raise its temperature. With a heat pump, one unit of electricity will create at least three units of heat, so is at least three times more efficient than a gas (or oil) boiler. A competent heat pump engineer should aim for a coefficient of performance of between 3.5 and 4.5 times.
So it’s this combination of less wasted energy and greater end-use sufficiency that mean that our electricity system only needs to be something like two and a half times the current electricity supply to electrify the economy. This is far smaller than a factor of seven that I have seen stated by those who fall victim to the primary energy fallacy.
It is not helped by the fact that DESNZ still publishes energy statistics showing primary energy in millions of tonnes of oil equivalent12. This is a gift to those that perpetuate the primary energy fallacy.
History of Electrification & Heat Pumps
I like to take an historical perspective on almost any issue and in this case it’s really useful to look back over 200 years of the history of electrification and heat pumps. In the 1880s Charles Brush powered his mansion with a wind turbine, and he used batteries to smooth out the ups and downs in the supply13. So the idea of using the combination of renewables and batteries is not new.
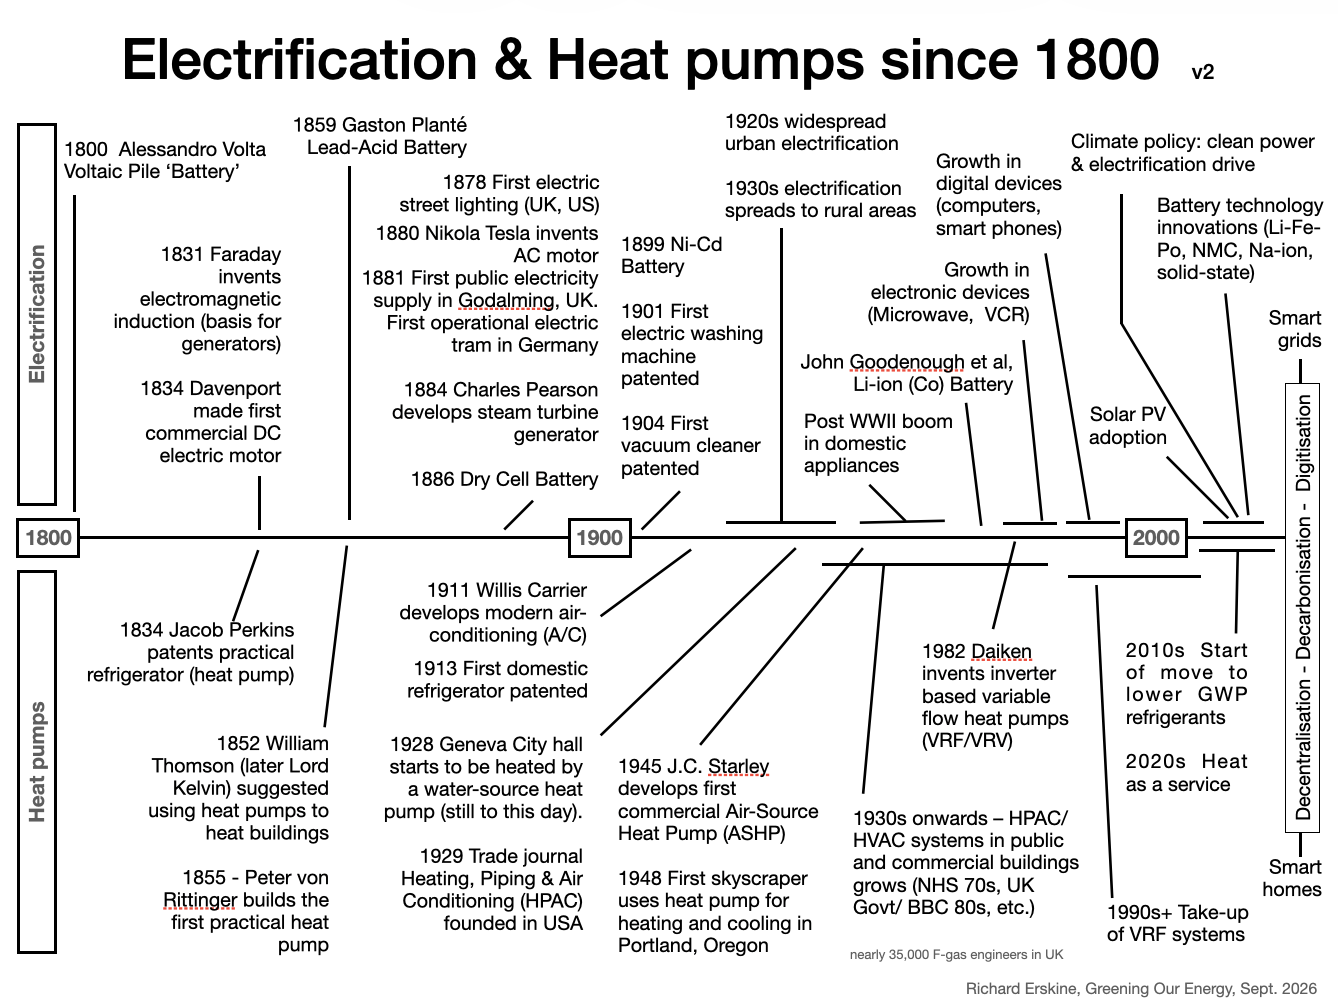
I prepared this Figure for previous talks and updated it for this one. It has a lot of text on it, reflecting some but not all of what has been happening in the world electrification and heat pumps since 1800. I’m going to pick out a few of the discoveries and applications:
- On the top track: Faraday inventing electromagnetic in 1831; the first electric street lightning in 1878; the first patent for an electric washing machine in 1901. Then in recent decades we’ve had several innovations in battery design and deployment that are revolutionising transport and the power grid.
- On the bottom track: Jacob Perkins patents a refrigerator in 1834 (a form of heat pump); In 1852 William Thompson (later Lord Kelvin) suggested using heat pumps to heat buildings and cool them. In the 1930s what we now call the HVAC industry (Heating, Ventilation and Air Conditioning) was beginning to build up, first in America and later in the UK; and in 1982 Daiken invented the inverter-based variable flow heat pump, which meant that they became more efficient and quieter.
So a lot has happened and continues to. Good technology finds many applications as I illustrated in the talk:
- Turning electricity into motion using a motor. We see that in a washing machine; in kitchen devices; in the starter motor in a petrol car; and in electric trains (powered by electricity on power lines).
- Turning motion into electricity using induction. We see that in old-fashioned doorbells; in the alternator in a car; and in a wind-turbine generating electricity for the grid.
- Battery applications are ubiquitous. We see them in torches; in wireless drills; now in Electric Vehicles (EVs). We even now see batteries in places where proponents of hydrogen cell vehicles claimed were beyond the limits of battery technology. We now have long-distance electric trains and heavy duty diggers using batteries. Freed from the need for power gantries, battery powered trains can use existing rail lines, reducing the speed and cost of electrification.
- Finally, we have heat pumps. We have them in any home that has a fridge, and in this case the heat pump moves heat from inside the fridge to outside of the fridge; we have air-conditioning units that move heat from inside the building to outside the building; and we have heat pumps for heating that move heat from outside the building to inside the building. We even have a heat pump in an EV! The batteries in the EV don’t like to get too hot in summer or too cold in winter, so a heat pump solves that issue. Heat pumps get everywhere, even my tumble-drier at home.
So we have these parallel histories, a long time in the making. A natural progression to electrify most of our end use of energy, and widespread use of heat pumps.
The future is smart grids and smart homes, and actually our national security depends on this.
Can you imagine an alternative 2050 where we have bet on gas as a main source of power and heating. Any reserves the UK may have had would dwindled to nothing. We’d now be dependent on an unstable middle east, an unreliable US, or a malign Russia. We’d be a vassal state, lacking any energy security. That would be a crazy thing to do, but it is the policy of right-wing parties in the UK.
Progress towards a UK clean energy future
So, how is the UK doing on a path to a clean energy future? I could show you a sequence of Sankey diagrams that energy geeks love to use. Instead, I am going to take the same official data but in a simplified representation that is more accessible to a lay audience.
I’ve summarised the data down to large blocks of energy and show the movement of these blocks of energy. Each of these blocks represents 100 TWh of energy a year, which is about four times what Hinckley Point C will generate in a year.
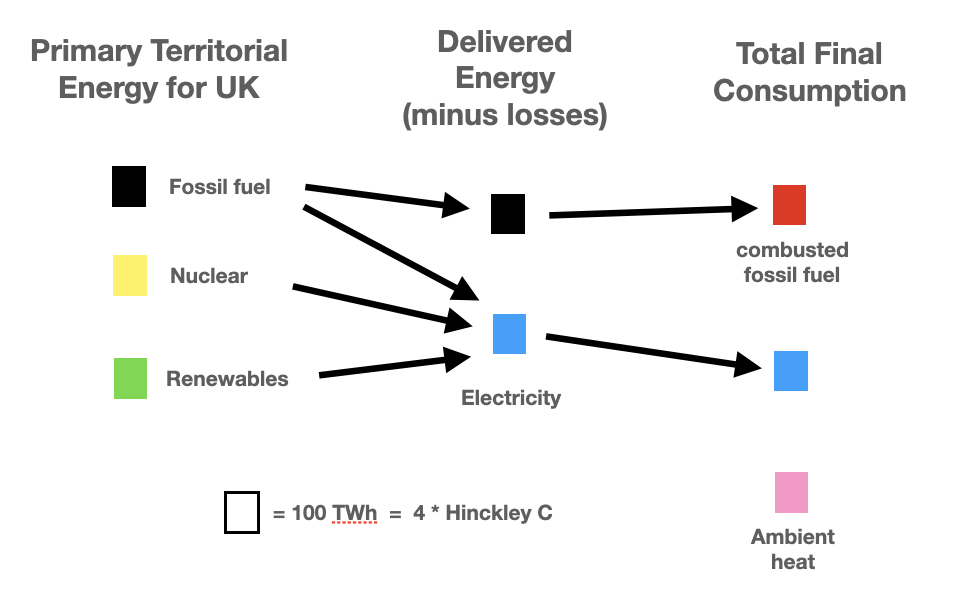
I have done this for representative years in the past and future: 2010, 2017, 2023, 2030, 2035 and 2050. For past years, I’m relying on the DESNZ energy flow charts13, which I will endeavour to simplify. I deliberately exclude bio-energy to simplify the sequence.
Each figure shows the flow of energy (and accounting for losses in the power sector) working from left to right: starting with primary sources of energy (fossil fuels, nuclear, renewables); then through a middle phase of transport of fuels (using ships, haulage or pipes) or the power sector; then onto final consumption of fossil fuels or electricity in four large sectors: Transport, Industry, Domestic and Other (where Other includes agriculture, public sector, and other services).
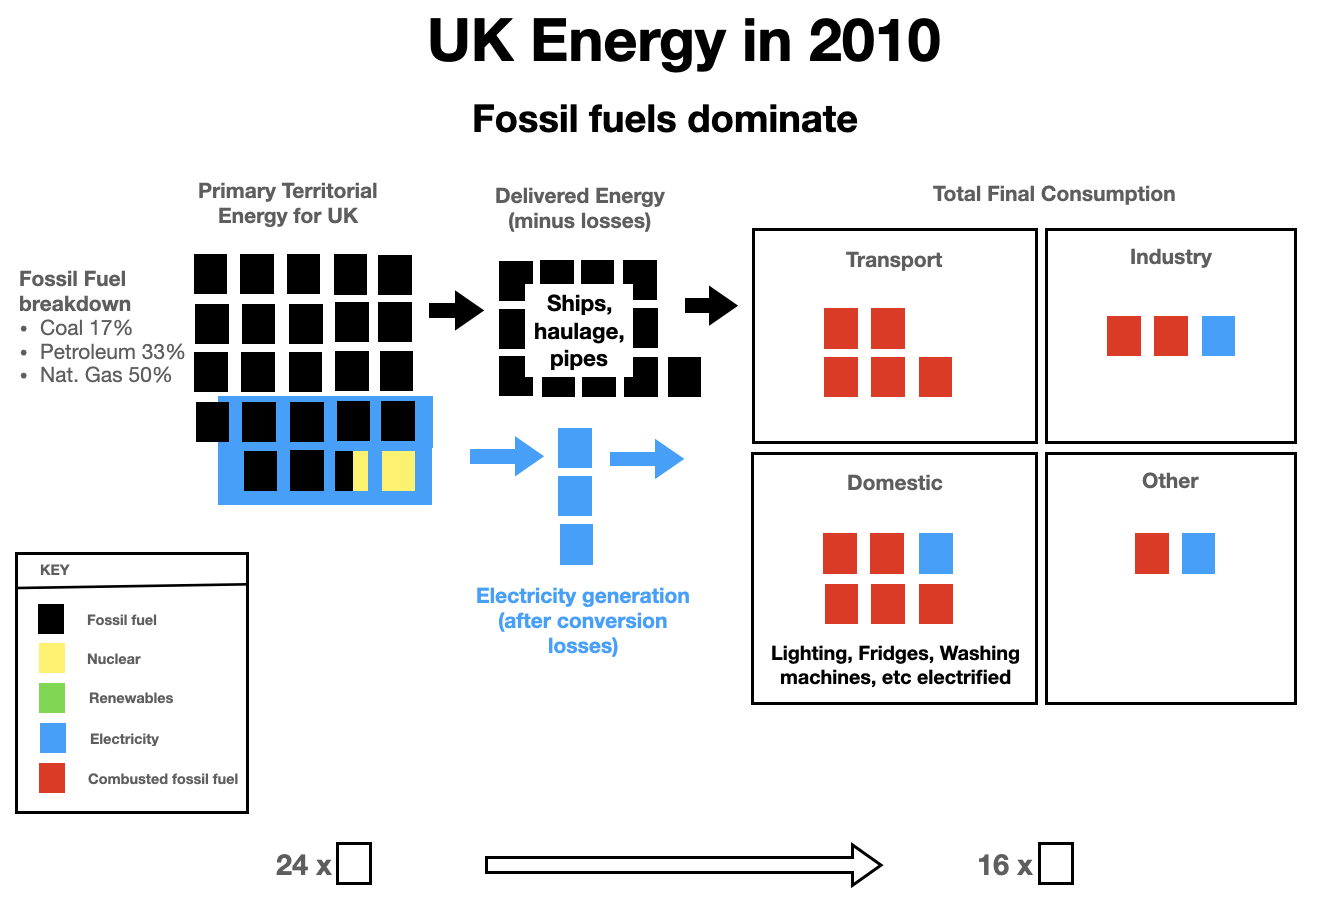
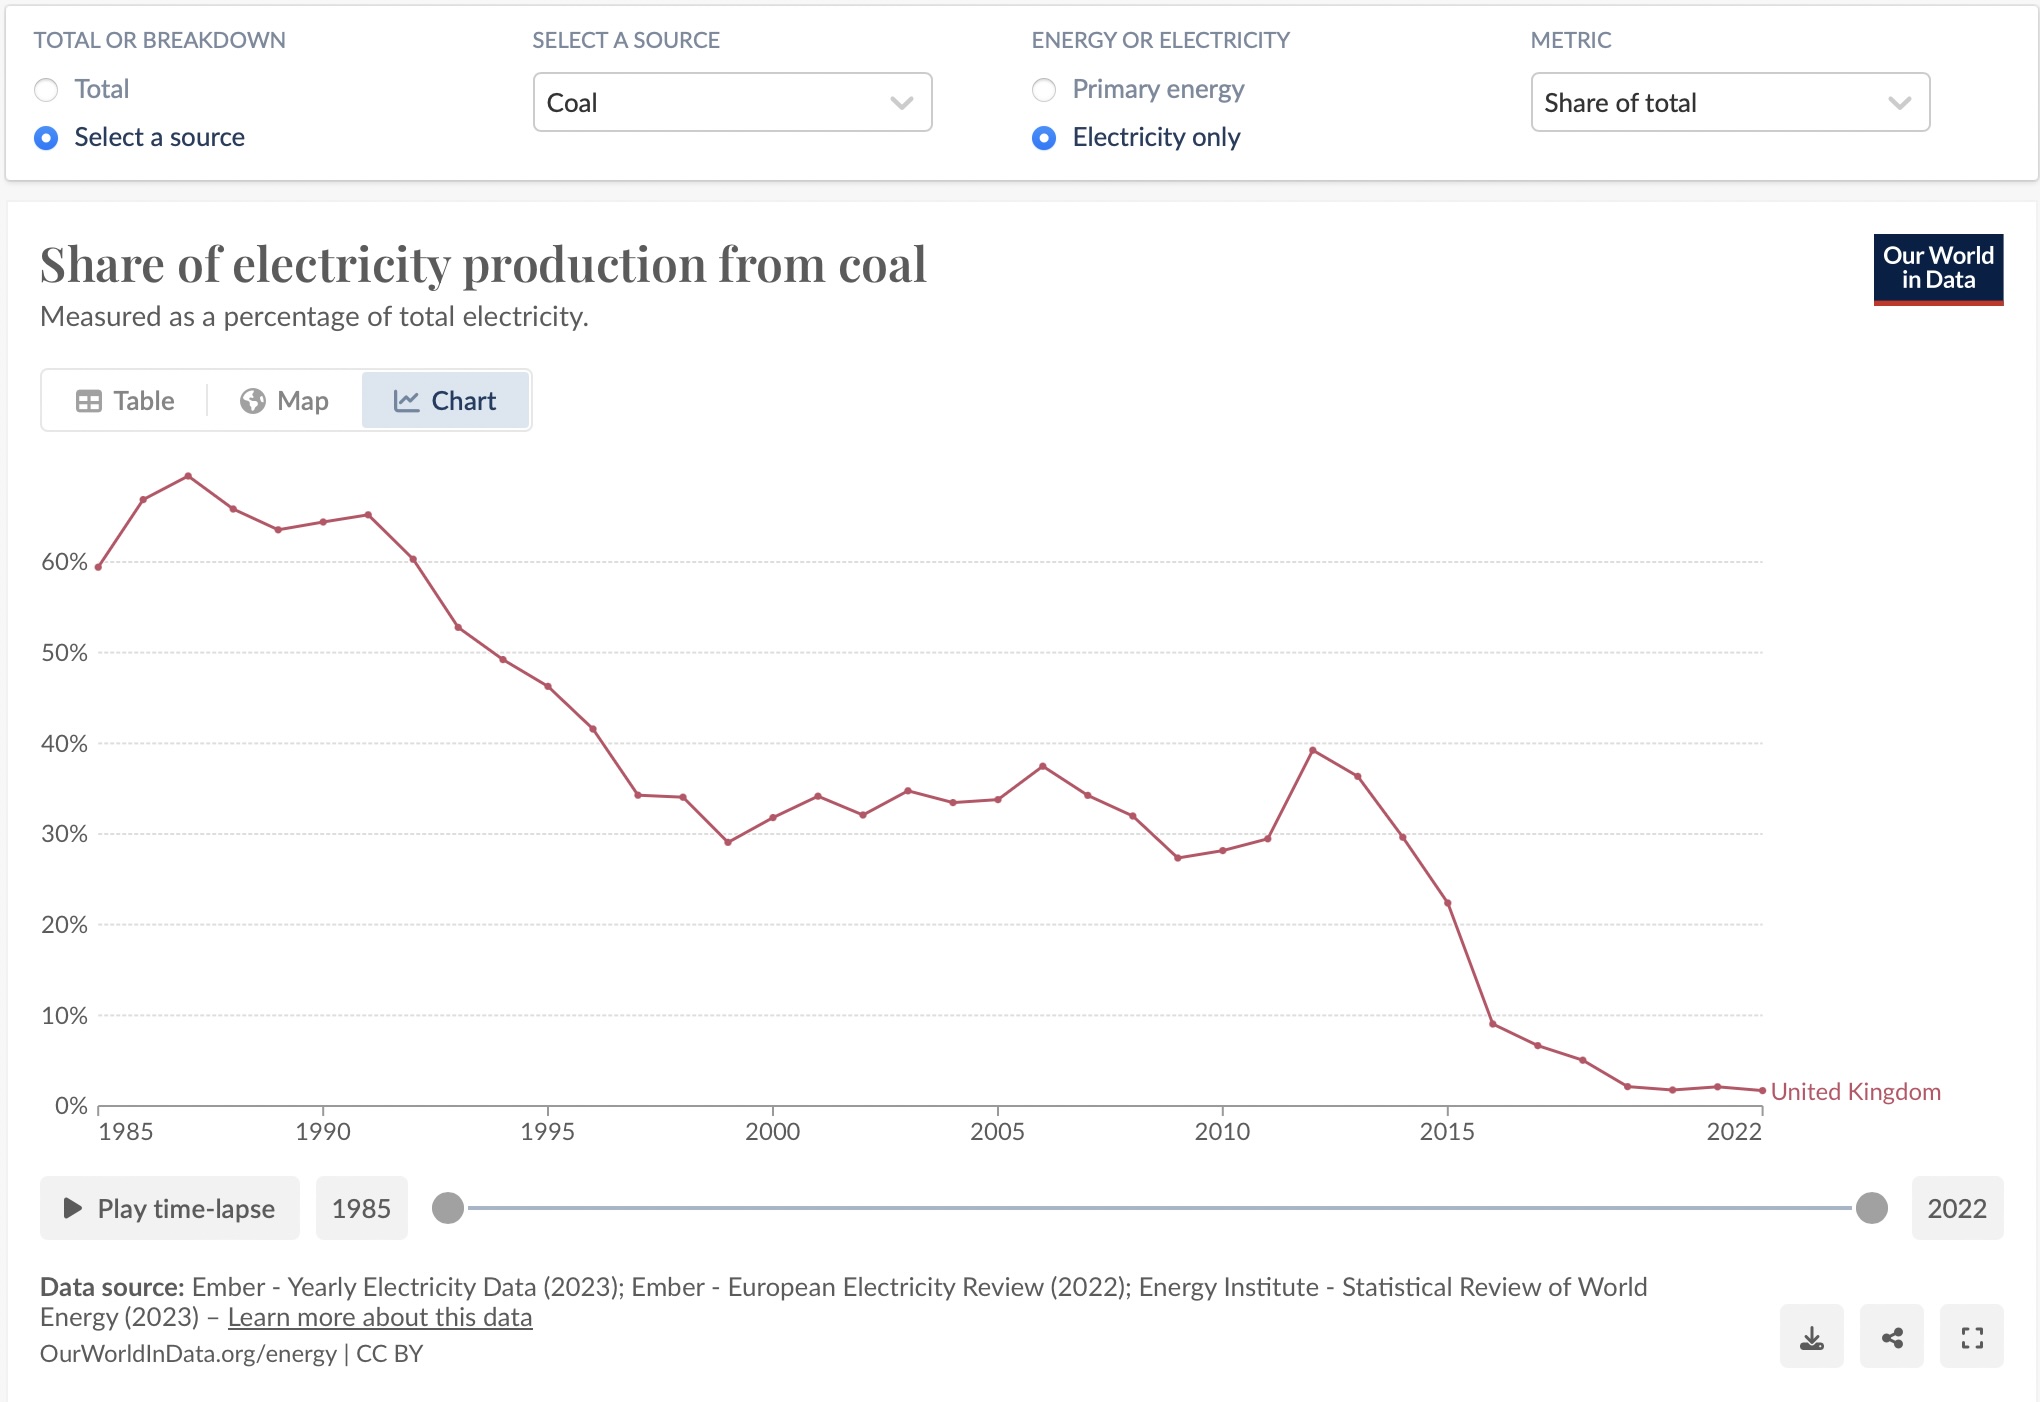
I’m starting in 2010, when the ‘dash to gas’ was well underway, replacing coal powered stations with gas powered stations. Coal was down to 17% of the fossil fuels used and natural gas was up to 50%, and there was some nuclear here as well, but with an aging fleet. We were generating three of these units of electricity (i.e. 300 TWh in round numbers) but needed eight units of primary energy to generate them (i.e. 800 TWh).
There is about one of these units of electricity going into each of the sectors Industry, Domestic and Other. Someone might say “oh, but didn’t we have electric trains back in 2010?”. Of course we did, but the amount of energy used doesn’t even add up to a slither on this very large scale of energy.
The majority of the energy used in society is fossil fuel based, moving around with ships, road haulage, or through pipes, and this is burnt in these different sectors to power cars, make steel and light up homes. Note that we’re starting off with 24 of these blocks; that’s 2400 TWh which is enormous. I want you to remember that 24 number on the left of the figure as we roll the years forward.
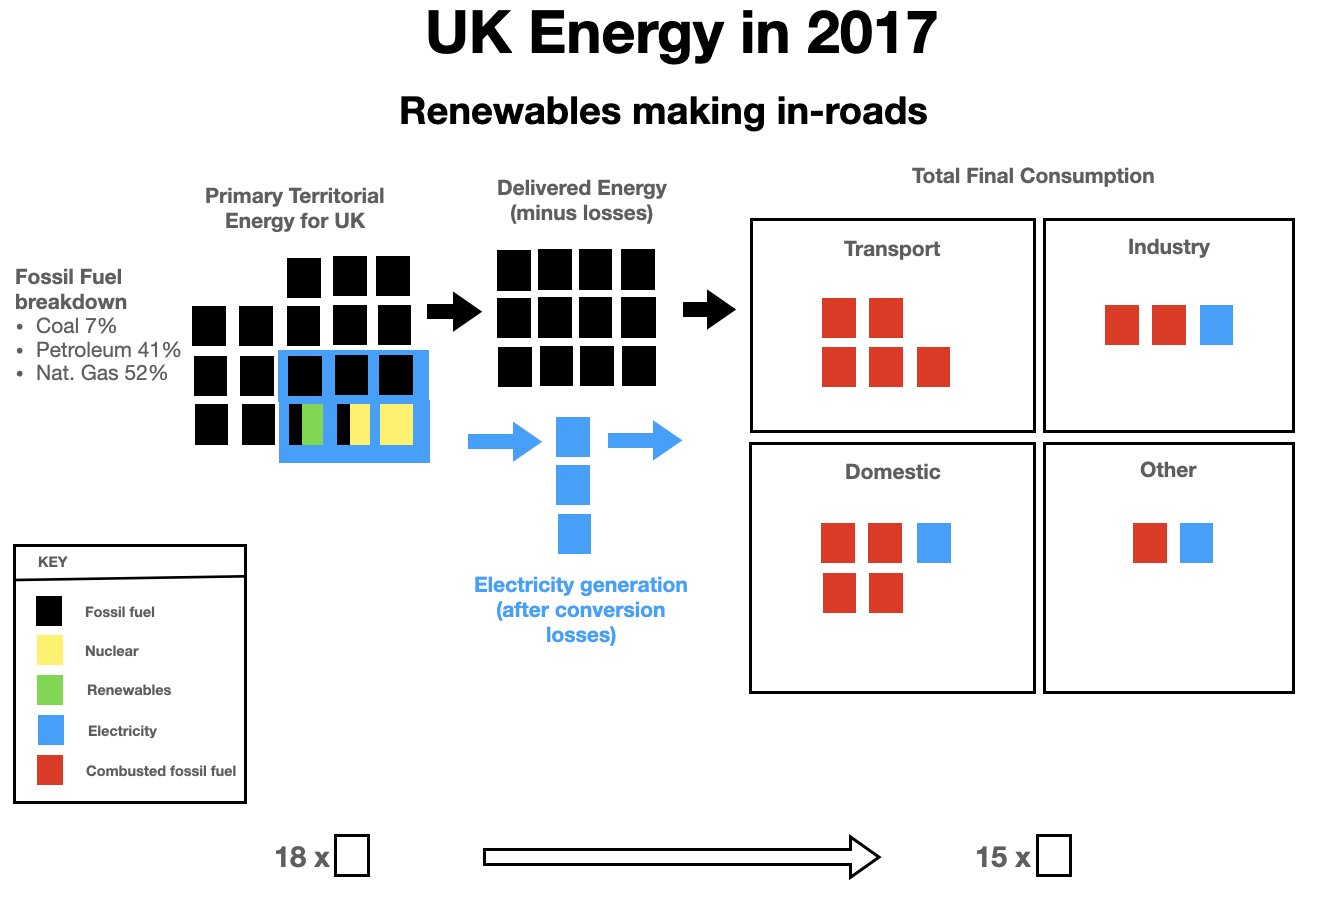
So let’s move forward 7 years to 2017. Coal is now down to 7% of the fossil fuels and we’re seeing renewables begin to make in-roads. We now have six units of primary energy needed to generate the three units of electricity. We’ve not increased the units of electricity in the economy.
We’ve still got a lot of fossil fuel moving around the country. What we’re seeing so far is a start in decarbonising the power sector, but not much else. We’re down to 18 units of primary energy delivering 15 units on the right.
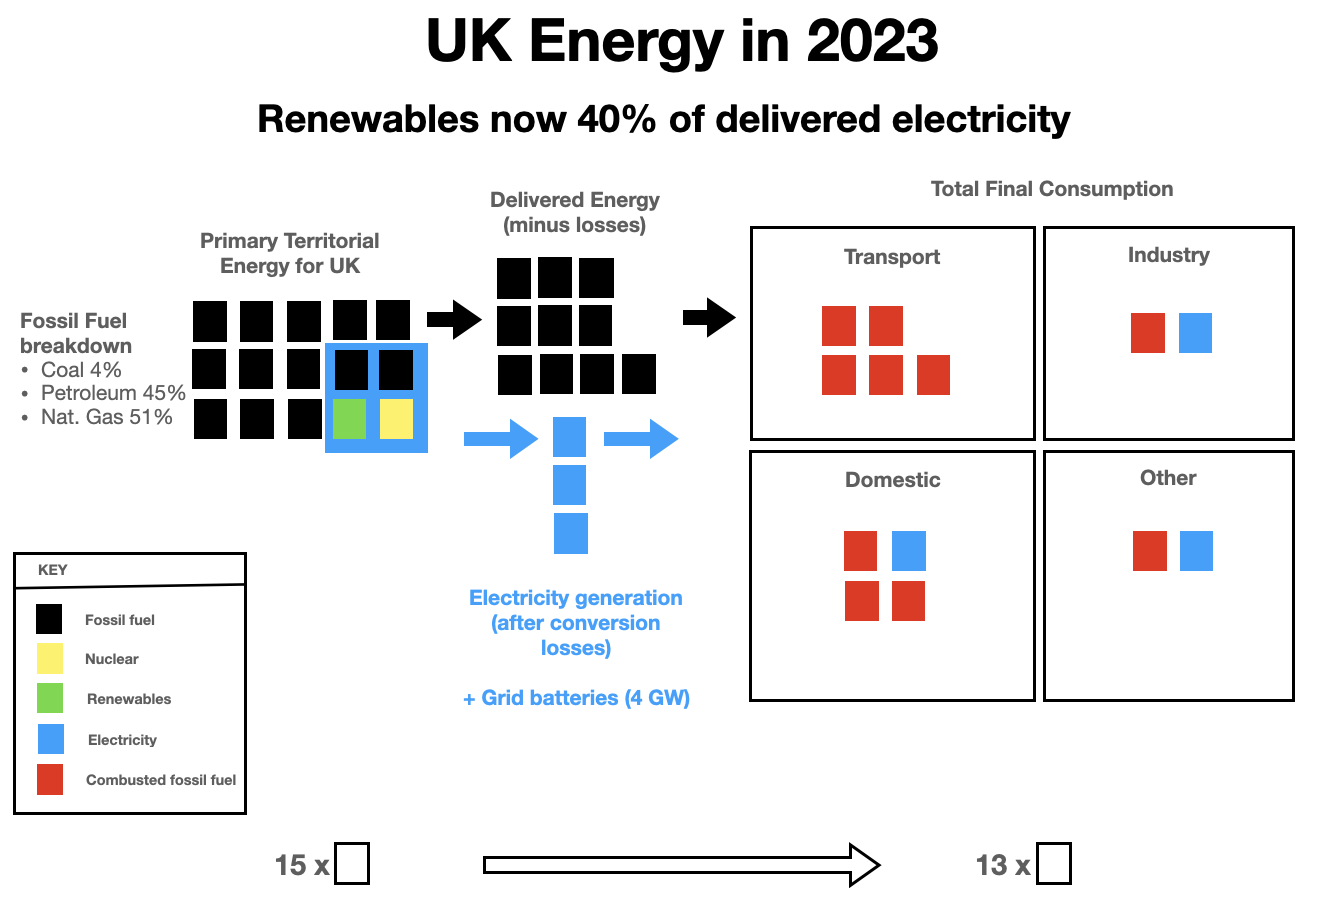
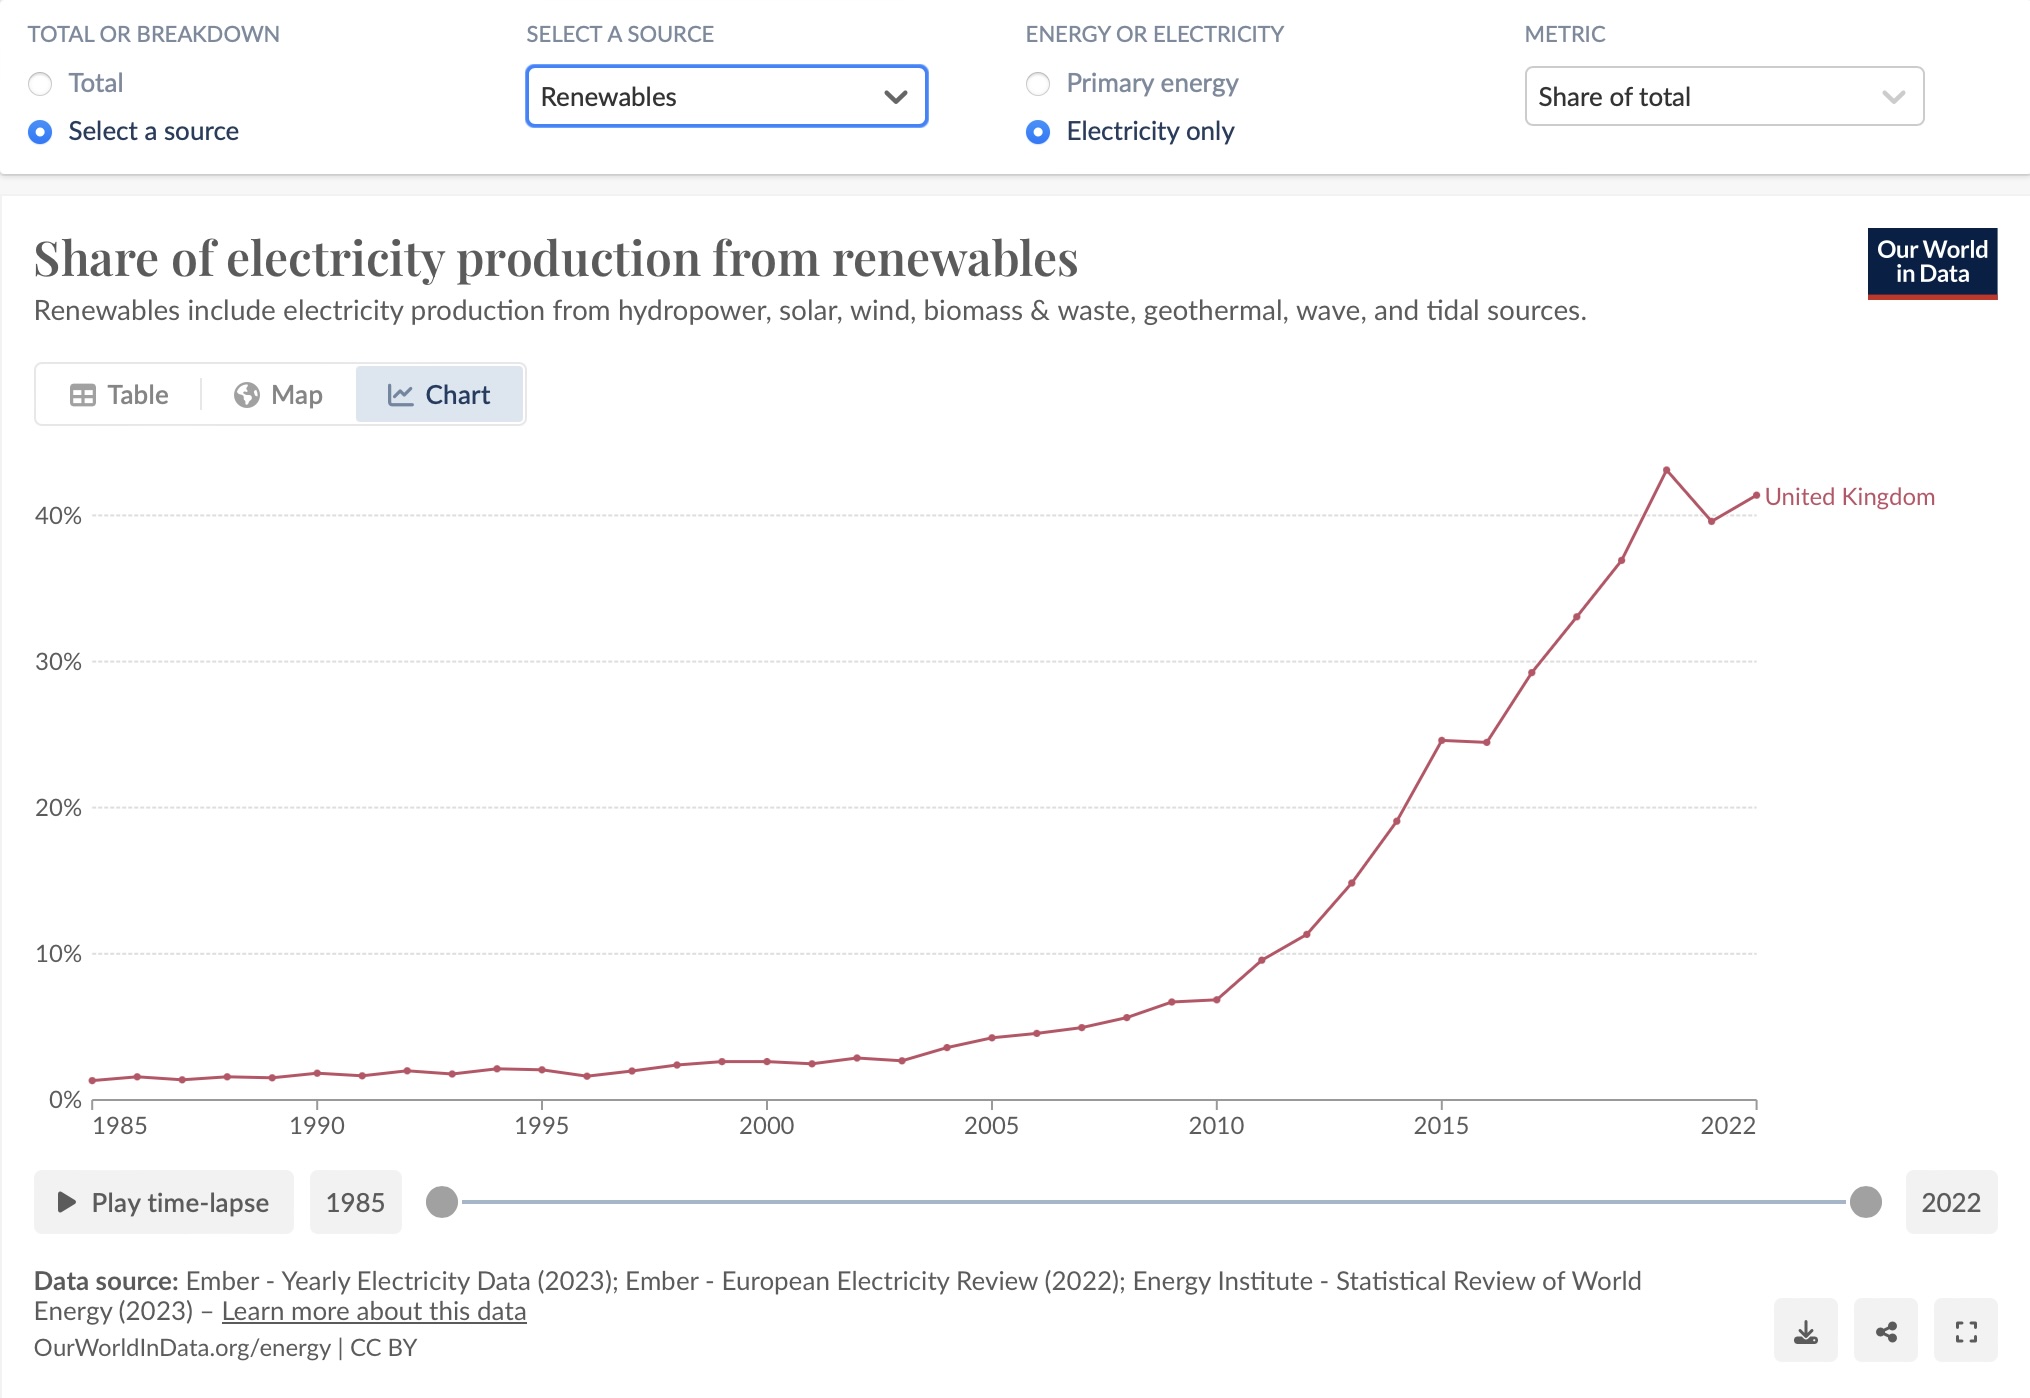
Move forward another 6 years to 2023 and we got a full block of renewables and coal is down to 4% (and within 18 months of this, coal disappears completely). At this point we need just four blocks of primary energy to deliver the three units of electricity, which is half the primary energy we had in 2010. That’s pretty impressive but is just a consequence of the huge waste of energy that comes with reliance on fossil fuels.
Nevertheless, we still haven’t really increased the amount of electrification in society, but we’ve added some grid batteries, which helps even out the flow of energy, especially as we add more variable renewable energy. There are efficiency gains in society’s use of energy over ths period.
We still have a lot of fossil fuels, but we are down to 15 units of primary energy, down from the original 24.
The target date the government has for clean power is 203014, but it hardly matters if it is 2029, 2030 , 2031 or thereabouts, as the trajectory is clearly heading there. Clean power is defined as eliminating fossil fuels from the power sector, almost completely, but with 5% of gas back-up.
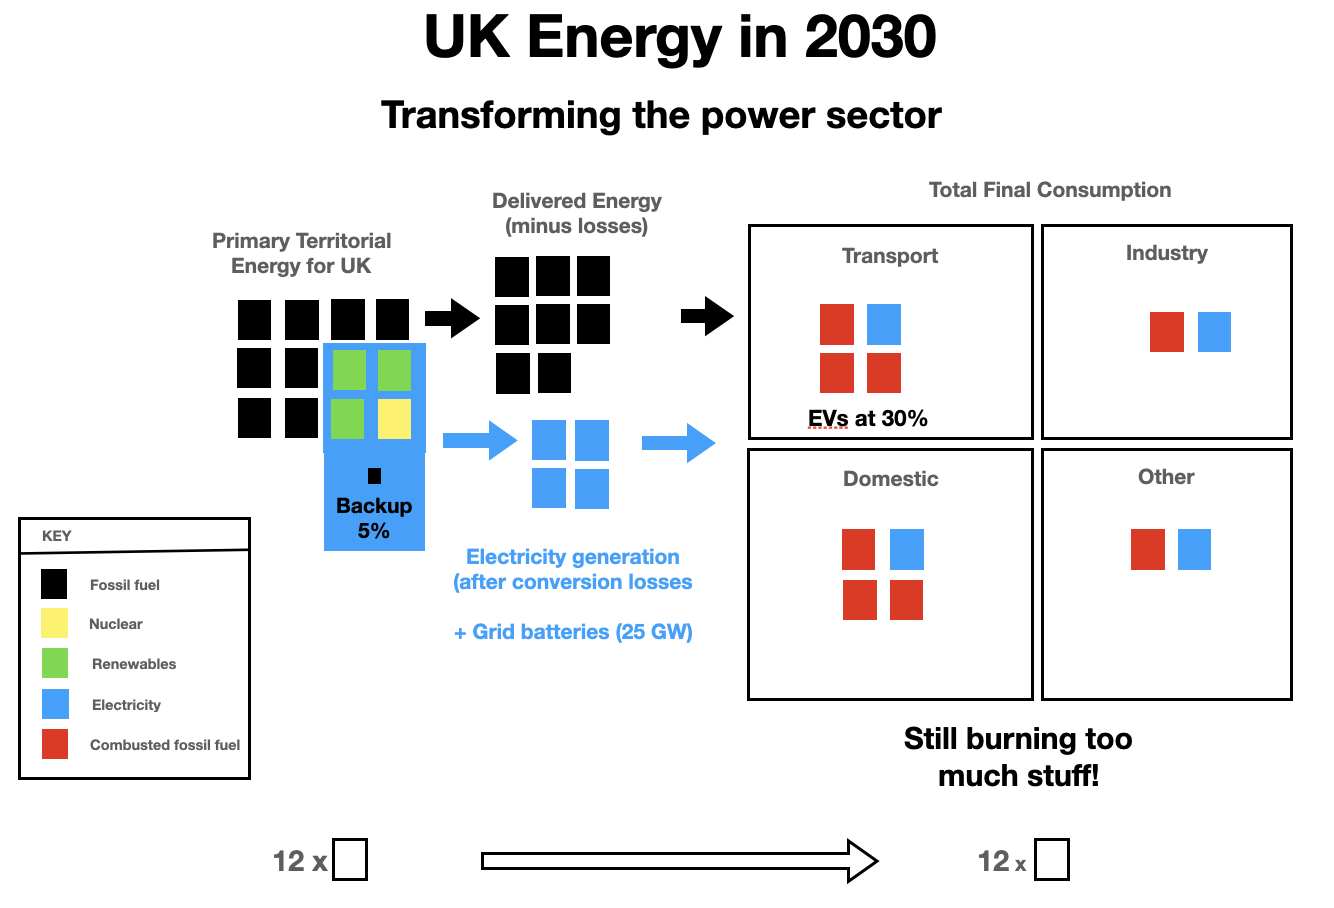
By 2030 we’re seeing one extra block of electrification, so we’ve increasing it from 3 to 4 blocks. One of these blocks (equivalent to 4 Hinckley Point Cs, is expected to come from nuclear power).
The adoption of Electric Vehicles (EVs) accounts for the extra block of electricity demand in Transport. EVs will then be between 20% and 30% of the fleet (according to various projections). I’m taking the higher estimate due to the impact of the conflicts in Ukraine and Iran accelerating take-up.
Grid batteries will have grown to something like 25 GB of power.
We’ll still be burning too much fossil fuel, but we’re down to 12 units of primary energy, so that’s half what we had in 2010, and that has occurred in the space of just 20 years.
Making the transition work for everyone
However, there’s an elephant in the room. Road transport and housing remain very dependent on fossil fuels, burning petrol/ diesel in cars and burning gas/ oil for heating. If we take the IMPACT Tool15 for almost any Parish in England, we see that these end-uses (transport and heating) make up about 40% of the domestic carbon footprint.
It is frustrating because there are energy efficient alternatives that can displace fossil fuels, massively decreasing the end-user costs of energy. There are even generous grants available to help with the upfront capital costs (currently, but always check current status using the links):
Boiler upgrade scheme (BUS)16 :-
- £9000 for qualifying off-grid oil boilers
- £7,500 pounds for replacing a gas boiler with heat pump
- £2,500 pounds when installing a ‘air to air’ heat pump
Zero emissions vehicles (Electric vehicles)17 :-
- Up to £3,750 dependent on qualifying manufacturing conditions
People then say that the level of adoption is help back by the price of electricity, but is it?
Why is the price of electricity so high in the UK?
The main and simple reason that electricity prices are high in the UK is that gas determines the price of electricity18 and we’ve been slow in upgrading the grid. How does this work?
Well, in every half hour window on the grid, the price of electricity is determined by the most expensive unit that goes onto the grid. There was a good reason for this, as it helped fund reliable backup power, which might be expensive to keep idle. Increasingly though it is proving problematic because the consumer, even those who consume little, are paying for it in there bills. It is even more stark because the cheapest forms of power (wind and solar) have been growing but the bills have remained high.
Imagine that wind has been supplying all of the electricity on the grid for 29 minutes, but gas is needed for the last minute of a half hour window (this can often happen because the generation and demand are at different ends of the country, and the grid cannot carry the required power).
Then all of the electricity in the half hour window would be priced by the gas, which is expensive, particularly now, during the latest fossil fuel shock caused by conflict.
This marginal price mechanism is not the only reason for how high electricity prices are in the UK. Other things get loaded onto the electricity bill, unlike in Europe. It is a separate talk to unpick all the various factors that go into the bill, which would take too much of a diversion to discuss here.
I do need to talk about one thing though and that is the ‘spark gap’, which is the ratio of the unit price of electricity to the unit price of gas. It was as high as four and a half but it’s coming down, and as of October 2026 has fallen19 to 3.3.
Saving money on heating switching to a heat pump
You might think, as many commentators seem to, that if you’ve got a ratio of electric to gas unit price, even of 3.3 that you could never make sense of moving to a heat pump.
Focusing only on the price of electricity, or even on the spark gap, does not answer the question “will my bill rise or fall when switching to a heat pump”. You also need to know the efficiencies of the boiler you are replacing and the heat pump system that replaces it. This is the game changer.
The new (from 1st Oct 2026) price cap unit rate for gas is 7.97p / kWh and for electricity is 26.32p / kWh. The standing charge for electricity and gas is now the same, at 29.04p / day (note: the ‘price cap’ applies to standard variable tariffs, but you can often do better on a fixed, ‘time of use’ or ‘smart’ tariff that matches your household’s electricity needs)
Take a typical home (according to Energy Saving Trust20) using 12,000 kWh of gas per year. You will then be paying: (12,000 x 7.97) + (365 x 29.04) = 106,239.6p a year,
which is (rounded and divided by 100) = £1,062 per year.
Although you are burning and paying for 12,000 kWh of gas, because the old boiler is about 80% efficient21, the actual heat the boiler delivers to your home is only 9,600 kWh. The rest is wasted.
Heat pumps need electricity to run, so we are now going to look at how much it would cost to deliver the same amount of heat (9,600 kWh) as the gas boiler. A mistake that people often make is to assume that you need 12,000 kWh of electricity to do this and that bills will be higher because the cost per kWh of electricity is higher than gas. But you have to take into account that the gas boiler wastes some of the input energy, and that every kWh of electricity used to power a heat pump generates (typically) 3.5 kWh of heat. This is known as the coefficient of performance.
So, the amount of electricity the heat pump uses to deliver 9,600 kWh of heat is:
9,600 kWh / 3.5 = 2,742.9 kWh a year
The cost of this amount of electricity is:
(2,742.9 x 26.32) + (365 x 29.04) = 82,792.7p a year
which is (rounded and divided by 100) = £828 per year
So, moving to a heat pump in this case would save: £1,062 – £828 = £234 per year.
There is also a saving of 1.7 tonnes of carbon dioxide emissions per year in making this switch. Assuming a 20 year life of the boiler that amounts to a 34 tonnes of carbon dioxide saving for this householder (that saving only improves as the grid gets greener).
Considering other households, this saving will be proportional to the gas usage we started with (given that the standing charges are the same), so if that had been 20,000 kWh on the annual gas bill, the savings would rise to £390 per year, for example.
This completely compensates for the high price of electricity relative to gas (26.32/7.97 = 3.3). It is worth noting that this ratio (known as the ‘spark gap’) has been falling fast in 2026, having started the year at 4.7 (in Q1 2026).
Obviously there is a Health Warning: the calculation depends on the ‘spark gap’ and on having a professional installation done of your heat pump. However, it’s already becoming easier to save money with the falling ‘spark gap’ and finding a competent heat pump installer is also not that hard if you follow good practice. NailsworthCAN has Buyer’s Guides to help a householder choose good suppliers22.
Is a Clean Energy ‘Tipping Point’ near?
Tipping points are not new and can be very fast. We’ve all seen the photos of New York as it went from mostly horse drawn carriages to mostly petrol cars in the space of a decade.
3 in 4 Britons are concerned about the climate change23. They are also, naturally concerned about the money in their pockets. It is no surprise that the cheapest forms of electricity generation (renewables) are much more popular than the most expensive (fossil fuels, especially shale gas) [see Note C].
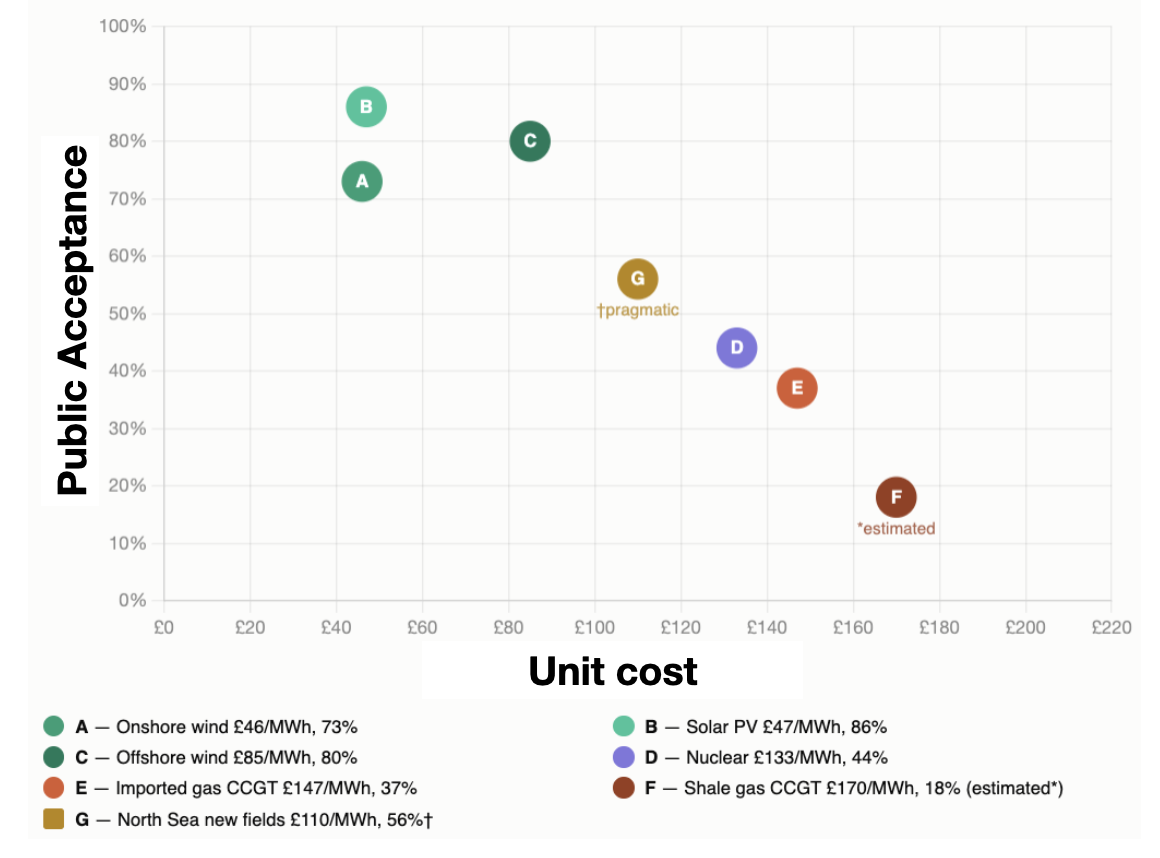
Now let’s take a look at EVs and petrol cars [see Note D]. The following chart shows new car registrations versus running costs. EVs will be cheaper to run than petrol cars whatever is happening in the world – that’s just physics – because of the wasted energy we discussed earlier.
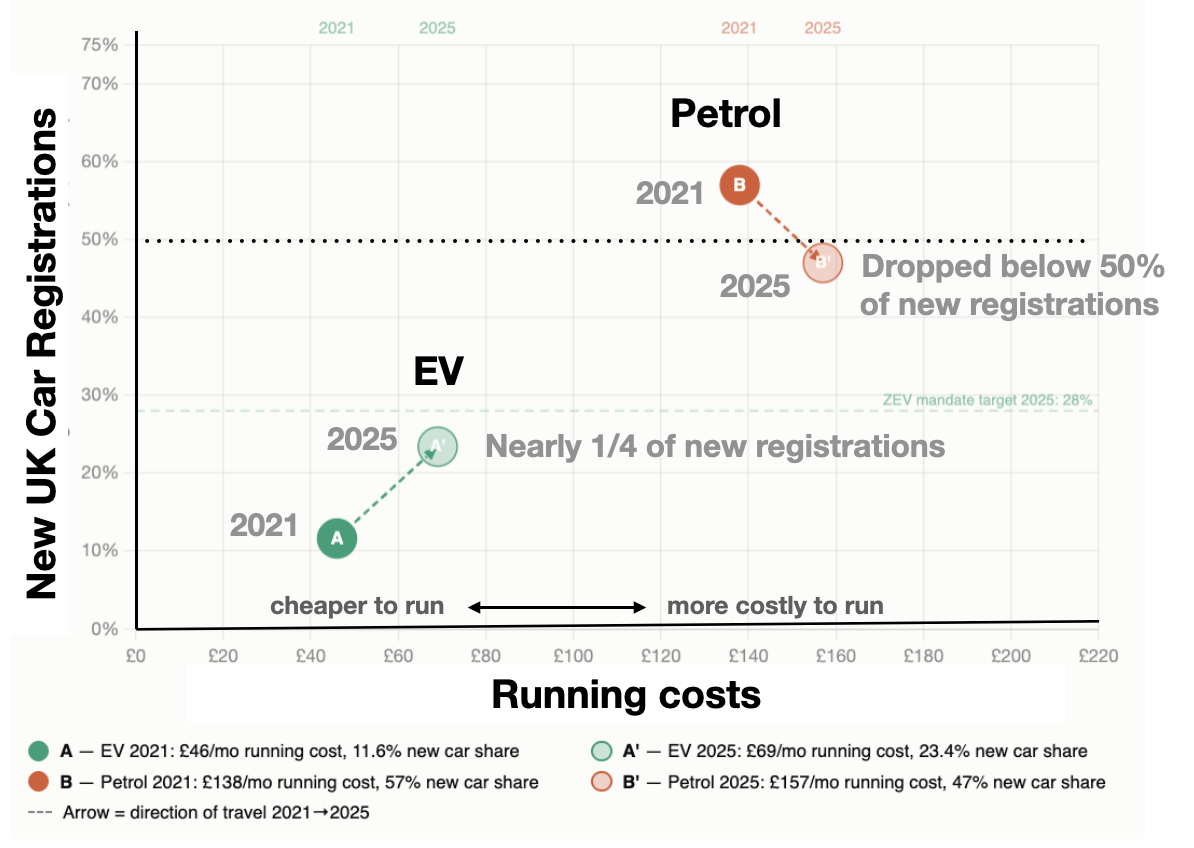
What is interesting here is that although the conflicts in Ukraine and the Middle East have increased the cost of both electricity and petrol, the registrations for EVs have gone up between 2021 and 2025 whilst those for petrol cars has gone down. EVs are now over 25% of new registrations whereas petrol cars have dropped below 50%. This trend is almost certainly going to continue. EVs have probably already passed a tipping point.
Heat pumps, as we have seen, are not new. In a commercial setting there were adverts in the early 1970s from the LEB (London Electricity Board) offering a free advisory service to businesses for “catering and air-conditioning (including heat pumps)”. Who knew?
Heat pumps are ubiquitous in our lives, although you probably haven’t noticed them. If you go into an department store and look up, you’ll see these ‘cassettes’ on the ceiling which are blowing warm air in winter and cool air in summer.
The heat pumps that are most discussed are those used by owner-occupiers, and known as ‘Air-Source Heat Pumps’ that can replace a boiler and connect to the traditional plumbing in a house (because it is a ‘wet system’ these are also classified as ‘Air-to-Water’ or A2W systems).
These are the target of so much disinformation from certain parts of the press, and from interest groups such as gas networks and their associated Unions. Andy Prendergast, GMB National Secretary for the Private Sector has argued24 that “ripping out the gas network for 25m homes is expensive stupidity”. Some will say we have gone from climate science denial to climate solutions denial, but they’re really the same thing: delaying the action we must take due to narrow self-interest.
The incumbents are fighting hard to hang on to the gas networks, and will engage in all sorts of erroneous or emotional arguments, and disinformation, to try to hang on.
One of the most pernicious is the idea that hydrogen boilers are a realistic alternative to heat pumps. This has been demonstrated to be an expensive illusion. The proponents of this idea have to resort to disinformation about heat pumps to try to justify it.
Professor Cebon has shown25 how, when taking account of the energy losses at each stage in the process, that heating UK homes with green hydrogen would require the UK to build 5.5 times as much wind capacity than if we simply use the electricity directly in heat pumps [see Note E].
In the face of this science, the gas lobby and their PR helpers have undertaken a well-funded media blitz against heat pumps26. They accuse those like Professor Cebon of an ‘anti hydrogen bias’ whereas he is just pro maths and pro science. The fact is that no peer reviewed studies support heating with hydrogen at scale27.
While heat pumps have a high take up in Scandinavia, the uptake in the UK is still too slow, possibly because some of the mud/ disinformation probably sticks, because it certainly isn’t because they cannot be cheaper to run than boilers, as I have illustrated earlier. The UK has a way to go before it reaches a tipping point as EVs have done, but it will come. Behaviour will follow the economics, and the economics will follow the physics. Once people realise the huge benefits from making the switch, the tide will turn.
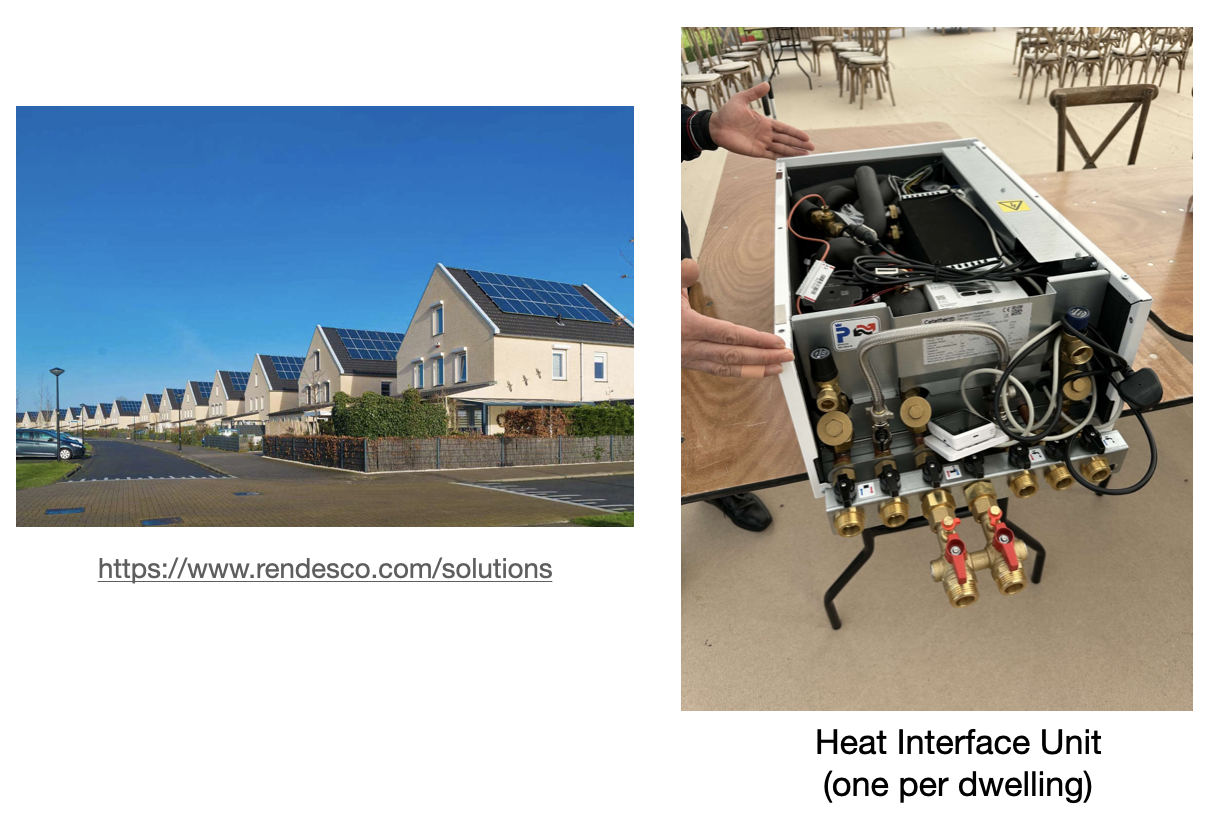
An alternative to individual owner-occupier heat pumps is to use what’s called a heat network. This uses a large heat pump (typically a ground-source one, which uses the thermal energy in the near surface ground, which is heated by the the Sun). Such systems deliver hot water via a ‘heat interface unit’ to each dwelling, both for space heating and for taps.
Then there is Zero Bills Homes, where Octopus Energy is teaming with some builders to build homes that each have solar PV, a battery and a heat pump. They can guarantee that you won’t have to pay anything for your electricity (given ‘fair use’ so this won’t cover the hot tub in the back garden!) .
Then there is the ground-up community ‘Heat Geek’ created by Adam Chapman28 which is revolutionising the training of heating engineers installing heat pumps, matching the good practice that is already available in well established small and medium sized heat pump installation companies (for example, aiming to reduce upfront costs by ensuring good ‘hydronic’ design principles are applied).
With examples like Octopus Energy and Heat Geek, who can claim Britain has lost the Great? We’re absolutely nailing it!
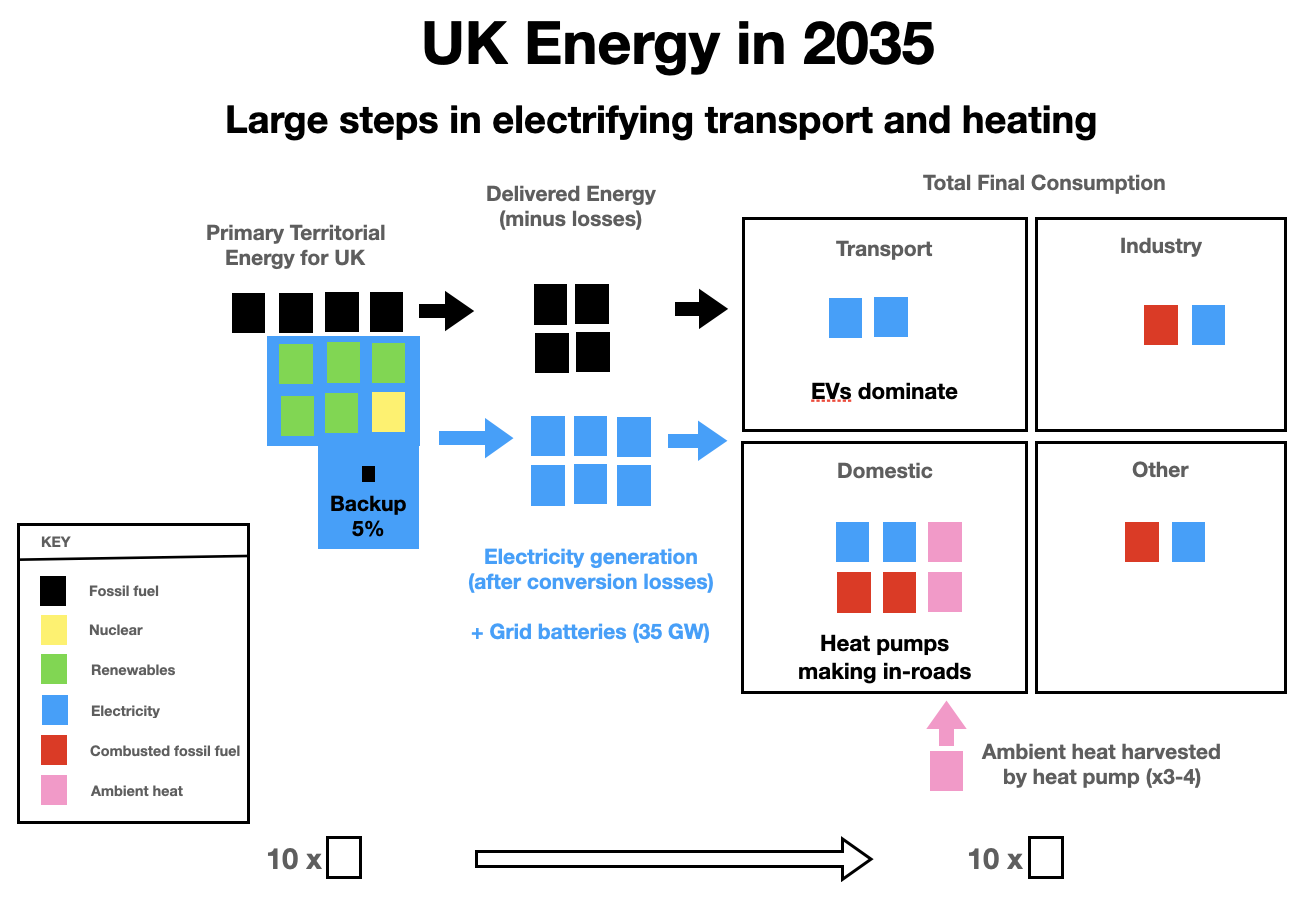
Fig. 17 – UK Energy Flows in 2035
So let’s move forward to 2035 and see how things look, with large steps on the electrification of end-use. We see six units of electricity being generated by six blocks of clean energy (although still with 5% backup from gas). This is double the electricity that we started with in 2010.
I’ve made an optimistic projection that EVs will dominate the fleet by 2035 (they will certainly completely dominate registrations, but might struggle to have displaced all petrol and diesel cars in the fleet by then). However, drivers of EVs already know it is vastly cheaper29 than driving a petrol or diesel car, which is again no surprise given the fundamental advantage30 in efficiency of an EV (requiring 2.5 times less primary energy per km). This is irrespective of prices at the pump.
Grid batteries will now be up to something like 35 GW, and probably don’t need to go much further.
We still have fossil fuels left in the system but while heat pumps will be making big in-roads they will not have completely displaced all of the gas and oil boilers.
So, we’re then down to 10 units of primary energy delivering 10 units of energy.
This will constitute enormous progress in the 25 years since 2010, and will already make the UK much less dependent on unreliable states. It’s not just about the numbers, it’s about the fabulous ingenuity and tireless efforts of so many to make this a reality.
The Path to 2050
We’ll need lots more energy storage! That’s the big thing that doesn’t get discussed much in the public. Yes, there is now a lot of chatter about grid batteries, but what about long duration storage?
Long durations storage
The UK Parliament does concern itself with it, as in a 2024 House of Lords Science and Technology Committee report31 on long duration storage that concluded that the Government should “get on with it”.
However, Brits know the principle of energy storage, as we applied it to the mills for hundreds of years with mill ponds storing energy and able to keep the mills running when a stream ran slack.
When we had the first power stations in the UK they had flywheels to store energy, to help maintain the frequency of the alternating current generated.
We can still have spinning things (despite what hyperventillating opinion pieces in The Telegraph might suggest), even after we’ve closed down the last gas turbine. They are called ‘synchronous condensers’.
We’ll need a wide diversity of storage systems which deal with things happening over a few seconds to several weeks. That’s everything from grid scale batteries, to pumped storage, to hydrogen stored in salt caverns, to thermal storage.
The Royal Society reported32 that in East Yorkshire alone “there are more than 3000 potential cavern locations in East Yorkshire alone that could each store 122 GWh of hydrogen. This equates to about 366 TWh”, and based on 37 years of weather data, the report estimated a need for 100 TWh of energy storage to deal with dunkelflaute episodes (or anti-cyclonic gloom as the Brits call it).
Detailed dynamic modelling, including a range of assets, has shown33 that a optimal approach can achieve 100% renewables penetration, with 15% curtailment (so not excessive over-build), and with a wind/ solar split of 84%/ 16%. They estimate resulting levelised costs of electricity much cheaper than that for the new nuclear reactors being built in the UK. This paper states:
“A growing body of evidence supports the fact that a 100% renewable-based electric supply can be achieved. However, a large penetration of renewables (defined as the fraction of the total electricity demand that is supplied by renewables) creates one major technical challenge: balancing the grid.”
They estimate this can be achieved with 43 TWh of storage, less than half the Royal Society estimate for the hydrogen to be stored in salt caverns.
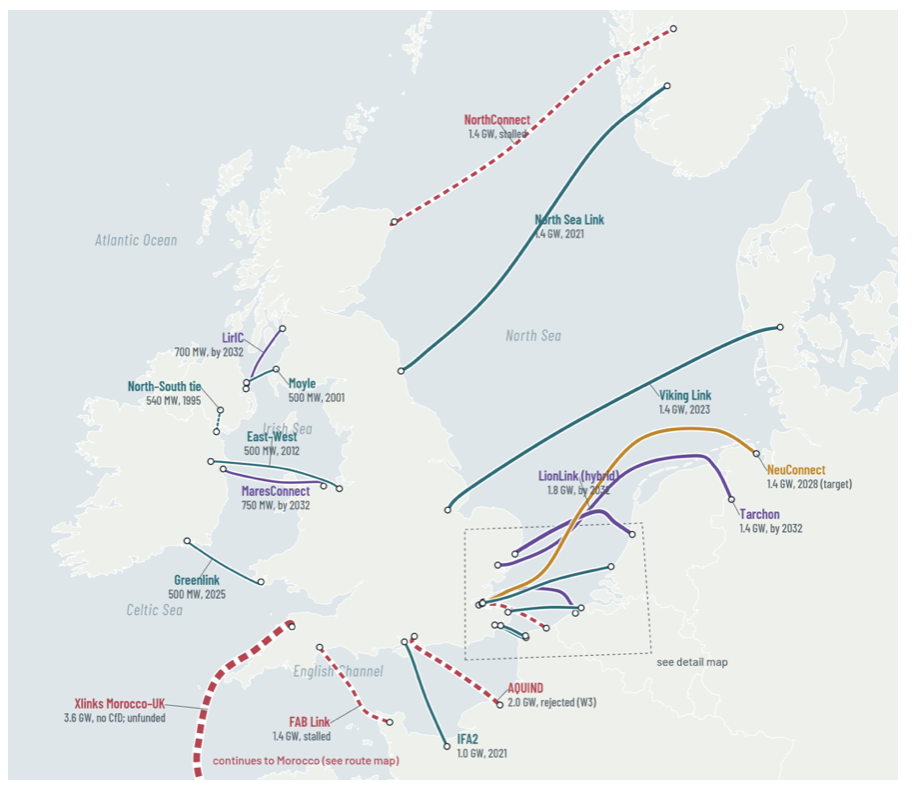
We shouldn’t forget the connectors that allow the UK to share excess power when we have it, and vice versa. While it is certainly possible to be 100% energy independent, that’s a very expensive solution that would require more energy storage than would otherwise be the case. We’ll need a balanced approach.
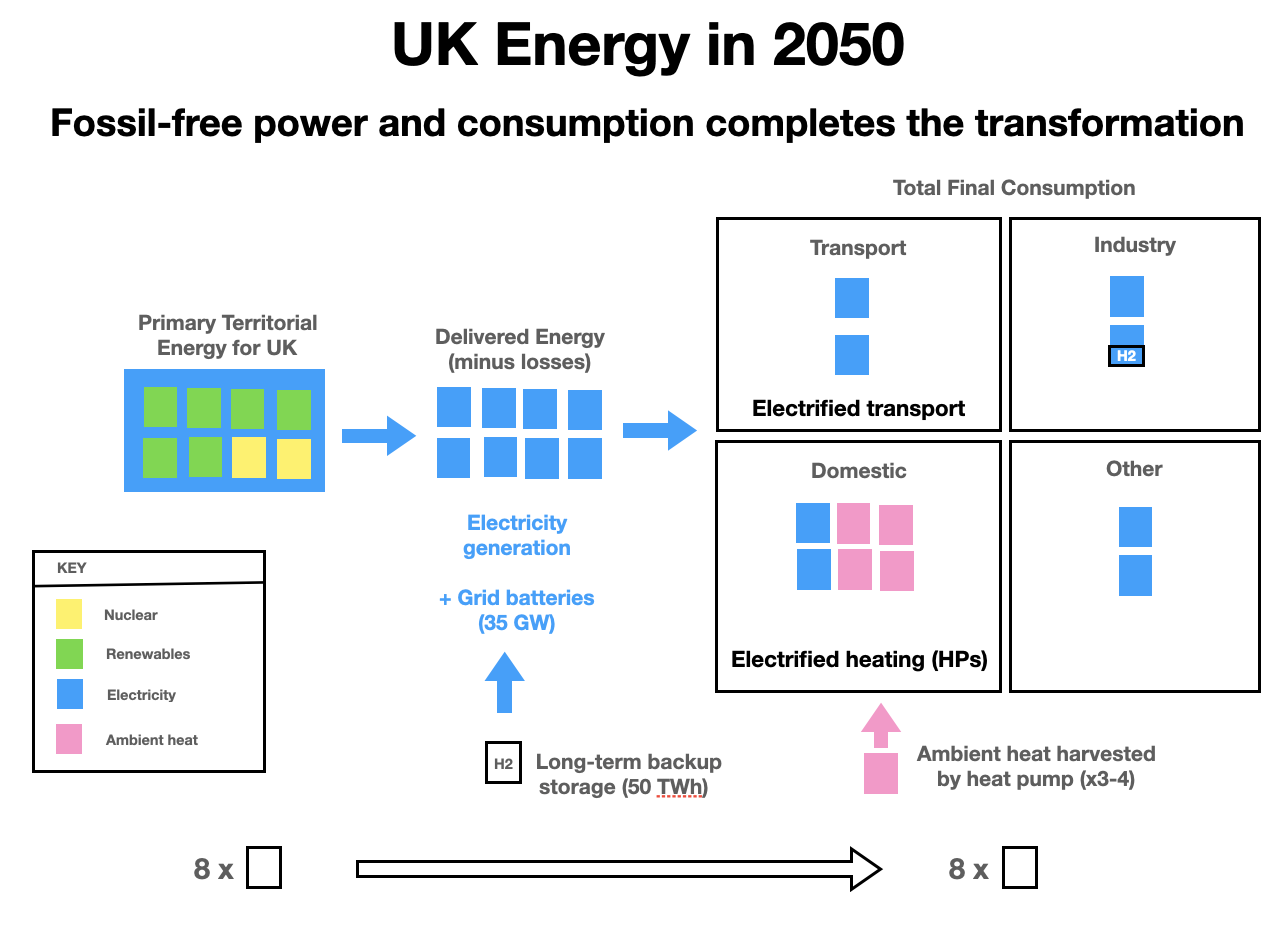
So, by the time we get to 2050 we’ll be up to 8 units of electricity being delivered, which is just over two and half times what we started with. The majority will come from renewables, but the Government expects that two of these blocks, or the equivalent of 8 Hinckley Point Cs, will come from nuclear power.
We’ll have electrified pretty much everything in the economy, although some processes – for example fertiliser production and ceramics – will need chemical processes. Even here we can use hydrogen created from green electricity as a chemical feedstock.
We will also use hydrogen as long-term storage to deal with those periods when there is limited wind and sunshine for extended periods; we just won’t be using it for transport or heating.
So, we are down from the original 24 units of primary energy down to 8 units.
Most of the disinformation you get from a lot of quarters assume that clean energy has to produce 24 units, because they do not take account of the energy losses and poor efficiencies of fossil fuel power and fossil fuel end-use, when compared with a clean energy, electrified future. That is the biggest single mistake made in most of the conversations around renewables.
Once we’ve modernised the grid and electrified end-use, we don’t really care what kinds of clean energy are used (as long as it is sustainable). If another form of energy comes along, say fusion power in 2070, you can simply plug it into the grid and we won’t have to change anything else.
What about land use?
People wonder if we have enough land in the UK for a renewables dominated energy future.
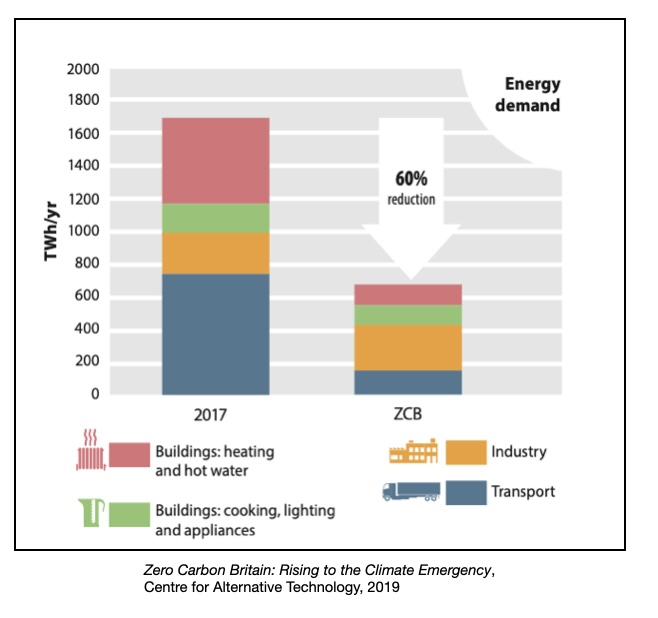
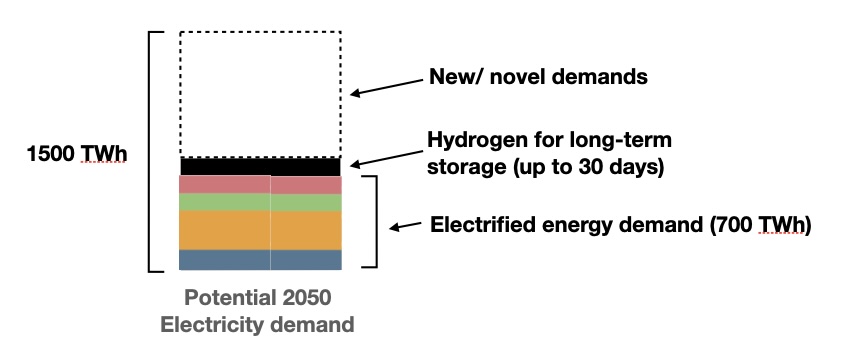
To test this, let’s look at a worst case scenario where energy demand has almost doubled from 800 TWh to 1500 TWh, to take account of potential additional forms of demand such as AI, synthetic meats, minerals recycling, etc.
This is what an Oxford University paper34 did, and they considered land based and marine renewables (and excluded nuclear for sake of argument). They found that even in this extreme scenario, the UK would need 7% of a British land for renewables (note that for the 2050 projection considered earlier, we’d need half of this).
Now while 7% is quite significant, ruminants use 50% of UK land for grazing. Surely we can spare 7% for renewables? If we can do more of it as communities, then we can go beyond this feeling that something is being done to us, and feel the benefits more directly. There are plenty of examples of community energy schemes, but there’s not enough and not at the scale required.
Cattle may actually appreciate shade from ground mounted solar when there are heat waves, so it can be a win-win for farmers and grazing animals.
A personal story
I want to close on a personal note. My wife and I with some friends bought a beautiful Grade 2 Listed Georgian house nearly 30 years ago, and split it into two dwellings.

Fig. 20 – Grade 2 Listed Home
We’ve done lots to it to restore the fabric of the building – sash windows, coping stones and much more. It’s been a lot of effort, but in the last few years things that we’d put in at the start, like a boiler, have started to creek and needed replacement (no ‘ripping out’ of a new boiler, just natural turnover).
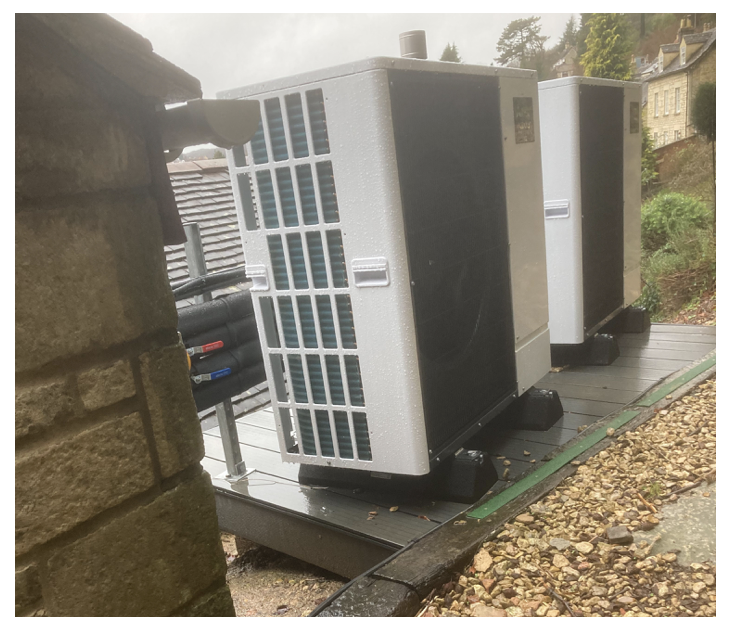
Five years ago, not wishing to lock in another 25 or more years of fossil fuel emissions, we replaced our aging gas boiler with an Air-Source Heat Pump. At the time in late 2021 there was a supply issue so instead of one larger ASHP we had two lower power ones. This turned out to be really effective as most of the year only one is running.
We were promised a seasonal coefficient of performance of 3.6 and that is exactly what we got. Because our old boiler was a meagre 72% efficient, we are paying less for our heating. I’ve told the story of this project elsewhere35.
Then last year our aging cooker (electric oven with gas hob) reached the point of being unserviceable. So we got a new cooker with an induction hob. We could then totally disconnect from the gas grid, and say goodbye to gas standing charges.
We had an old diesel car, and we could see how the conflict in the middle east was going to play out. The price of diesel was going up and there could be problems even with the supply of diesel before long. We had already decided to get an EV as our next car, but this brought the decision forward, so we made a strategic decision to get an EV.
We were also able to get a home charger inside our garage avoiding any listed planning issues (all cabling being internal).
While social media ‘experts’ would no doubt tell us we’d need 3 phase to have a heat pump and an EV charger, we in fact have only an 80A mains fuse. The heat pump is set back by a few degrees at night and the house has high thermal mass, so it tends to go off for most of the night allowing charging to take place. The electrician fitted protection to prevent the 80A current being exceeded, but we won’t exceed it.
The saving on the cost of motoring is very high, and sufficient to mitigate the cost of leasing the EV.
So this house that is 200 years old, is now fully electrified, and ready for the next 200 years.
I’ve lost count of the home energy ‘experts’ who told me this was impossible without ‘deep retrofit’, but all we did on insulation was beef up the loft insulation and added some draught-proofing, such as the brushes for the sash windows. The single glazing remained.
If it can be done here, it can be done anywhere.
When not giving talks and engaging people wanting help with energy matters (I volunteer at my local library) I also work with The Schumacher Institute in Bristol, which aims to apply ‘systems thinking’ to understand society and moving to a more sustainable future. For those interested in how the UK’s energy system might now be approaching a tipping point, towards a clean energy future, they may like to look at a paper I have recently published36.
I believe that despite ‘noises off’, in the UK at least, greening our energy is sooner than you may think.
(c) Richard W. Erskine, 2026
REFERENCES
- MetOffice Hadley Centre Central England Temperature, https://www.metoffice.gov.uk/hadobs/hadcet/data/download.html
- Smoothing was done using the LOESS method (Locally estimated scatterplot smoothing) [see https://www.ncei.noaa.gov/access/monitoring/dyk/loess] – The curve showing this data was generated using Claude / Opus 5.5 Medium.
- The Discovery of Global Warming, Spencer Weart, 2003 (2026), American Institute of Physics, https://history.aip.org/climate/summary.htm
- IPCC Sixth Assessment Report, Working Group 1: The Physical Science Basis, Summary for Policymakers Headline Statements, 2021, Intergovernmental Panel on Climate Change, https://www.ipcc.ch/report/ar6/wg1/resources/spm-headline-statements/
- Extreme Weather: Explainer, The Royal Statistical Society, https://rss.org.uk/policy-campaigns/policy/climate-change-explainers/explainer-extreme-weather/
- Rapid Warming in the Himalaya Exacerbates Geohazard Cascades Beyond Adaptation Limits, 17 September 2026, World Weather Attribution, https://www.worldweatherattribution.org/rapid-warming-in-the-himalaya-exacerbates-geohazard-cascades-beyond-adaptation-limits/
- What is Science?, Richard Feynman, The Physics Teacher, volume 7, issue 6 (1969), p.313-320 – it was presented at the fifteenth annual meeting of the National Science Teachers Association, in New York City (1966) and includes the quote “Energy is a very subtle concept. It is very, very difficult to get right.”
- Zero Carbon Britain: Rethinking the Future, Centre for Alternative Technology, 2013
- Sustainable Energy – without the hot air, David Mackay, 2008, UIT Cambridge Ltd
- Factcheck: How nuclear, gas, wind and solar power are affected during heatwaves, Molly Lempriere, 4th August 2026, CarbonBrief, https://www.carbonbrief.org/factcheck-how-nuclear-gas-wind-and-solar-power-are-affected-during-heatwaves
- The Primary Energy Fallacy — or, Committest Thou NOT the 2nd Sin of Thermodynamics!, Paul Martin, Spitfire Research Inc., June 2024, https://spitfireresearch.com/the-primary-energy-fallacy/
- Have we been duped by the primary energy fallacy?, Jan Rosenow, Medium, November 2024, https://medium.com/@jan.rosenow/have-we-been-duped-by-the-primary-energy-fallacy-167f53c58961
- Digest of UK Energy Statistics (DUKES) 2026, 30 July 2026 (Last updated 29 Sept. 2026), https://www.gov.uk/government/statistics/digest-of-uk-energy-statistics-dukes-2026
- Energy Flow charts (collection), https://www.gov.uk/government/collections/energy-flow-charts
- Clean Power 2030, NESO, https://www.neso.energy/publications/clean-power-2030
- IMPACT – Community Carbon Calculator, Centre for Sustainable Energy and Exeter University, https://impact-tool.org.uk/
- Boiler Upgrade Scheme (BUS), https://www.ofgem.gov.uk/environmental-and-social-schemes/boiler-upgrade-scheme-bus/boiler-upgrade-scheme-bus-property-owners
- Zero Emissions Vehicles, https://www.gov.uk/zero-emission-vehicle-grants/cars
- Factcheck: Why expensive gas – not net-zero – is keeping UK electricity prices so high, Simon Evans and Molly Lempriere, 20th May 2025, CarbonBrief, https://www.carbonbrief.org/factcheck-why-expensive-gas-not-net-zero-is-keeping-uk-electricity-prices-so-high
- Mind the spark gap: the number that could shape your future energy bills, Sam Whitworth, 23rd September 2026, Octopus Energy, https://octopus.energy/blog/mind-the-spark-gap/
- What is the average UK energy bill?, Joanna O’Loan, 30th Jan 2026, Energy Saving Trust, https://energysavingtrust.org.uk/average-uk-energy-bill/
- Note that a Energy Saving Trust sponsored report found that in-situ boilers (under 2 years old) were on average 82.5% efficient on average (not the touted 90%), so 80% for an old boiler is not unreasonable – https://assets.publishing.service.gov.uk/media/5a75149be5274a3cb28697f7/In-situ_monitoring_of_condensing_boilers_final_report.pdf
- Retrofit Buyer’s Guides, Richard Erskine, Nailsworth Climate Action Network, https://www.nailsworthcan.org/
- 3 in 4 Britons (74%) concerned about climate change today following heatwave summer, 7th August 2026, IPSOS.
- National Gas boss warns businesses could be threatened if network scrapped, Nicholas Earl, 18th October 2023, CityAM, https://www.cityam.com/gmb-union-hammers-proposals-to-back-heat-pumps-over-hydrogen-boilers/
- Hydrogen for heating? A comparison with heat pumps (Part 1), David Cebon, 15th April 2022, Hydrogen Science Coalition, https://h2sciencecoalition.com/blog/hydrogen-for-heating-a-comparison-with-heat-pumps-part-1/
- Revealed: Media Blitz Against Heat Pumps Funded by Gas Lobby Group, Phoebe Cooke, 20th July 2023, https://www.desmog.com/2023/07/20/revealed-media-blitz-against-heat-pumps-funded-by-gas-lobby-group/
- A meta-review of 54 studies on hydrogen heating, Jan Rosenow, 2023, Cell Reports Sustainability, https://www.sciencedirect.com/science/article/pii/S2949790623000101
- ‘We’re ready to explode in scale’: Adam Chapman, the Heat Geek founder set on getting Britain decarbonised and warm, Jillian Ambrose, 20th August 2024, https://www.theguardian.com/business/article/2024/aug/20/were-ready-to-explode-in-scale-adam-chapman-the-heat-geek-founder-set-on-getting-britain-decarbonised-and-warm
- Analysis: EVs are now nine times cheaper than petrol or diesel to drive in the UK, Molly Lempriere and Ho Woo Nam, 24th September 2026, Carbon Brief, https://www.carbonbrief.org/analysis-evs-are-now-nine-times-cheaper-than-petrol-or-diesel-to-drive-in-the-uk
- Hydrogen Fuel Cell vs Battery EVs 2026: Efficiency, Costs and Use-Cases, January 2026, Energy Solutions Intelligence. https://energy-solutions.co/articles/sub/hydrogen-fuel-cell-vs-battery-ev-2026
- Long-duration energy storage: get on with it, HL Paper 68, Science and Technology Committee, House of Lords, 13 March 2024. https://publications.parliament.uk/pa/ld5804/ldselect/ldsctech/68/68.pdf
- Large-scale electricity storage – Policy Briefing, September 2023, The Royal Society, https://royalsociety.org/-/media/policy/projects/large-scale-electricity-storage/large-scale-electricity-storage-policy-briefing.pdf
- Energy Storage Capacity vs. Renewable Penetration: A Study for the UK, Bruno Cárdenas et al, Renewable Energy 171, 2021, pp.849–867. https://www.sciencedirect.com/science/article/abs/pii/S0960148121003281
- Wind and solar power could significantly exceed Britain’s energy needs, Brian O’Callaghan et al, Smith School of Enterprise and the Environment, Oxford University, https://www.smithschool.ox.ac.uk/sites/default/files/2023-09/Could-Britains-energy-demand-be-met-entirely-by-wind-and-solar-SSEE-working-paper.pdf
- Heating a listed Cotswold stone building with an air-source heat pump: our journey, Richard Erskine, 23rd March 2023, https://essaysconcerning.com/2023/03/29/heating-a-listed-cotswold-stone-building-with-an-air-source-heat-pump-our-journey/
- Is the UK approaching a Clean Energy Tipping Point? – Exploring the UK’s Clean Energy Transition using a Systems Thinking approach, Richard W. Erskine, A Schumacher Briefing, 4 August 2026, The Schumacher Institute, https://www.prepareforchange.org/tsireadings/briefings/uk-clean-energy-transition/
NOTES
A. The power of the Sun on Earth – land area requirement to meet humanity’s needs
The power per unit area (p) of the sun at Earth’s distance from it is about 1300 W/m2
Think of this passing through a ring with a radius (R=6.4 x 10⁶ m) equal to that of the Earth’s sphere.
So the total power Pe = p π R2 = 170,000 TW
This matches the figure that Frank Niele used in a quote from his book:
“The planet’s global intercept of solar radiation amounts to roughly 170,000 TeraWatt [TW] … [man’s] energy flow is about 14 TW, of which fossil fuels constitute approximately 80 percent. Future projects indicate a possible tripling of the total energy demand by 2050, would correspond to an anthropogenic energy flow of around 40 TW. Of course, based on Earth’s solar energy budget such a figure hardly catches the eye …”
Energy: Engine of Evolution, Frank Niele, Shell Global Solutions, 2005
But the power (p) at earth’s surface is closer to 1000, due to atmospheric dispersion/ reflection of energy, so we get a figure of (1000/1300) x 170,000 = 130,000 TW in total.
130,000 is roughly 10,000 times 14 TW, as I stated in the text. So far so good.
Now the average power will be this total, but averaged over the surface area of Earth (4 π R2) and this thereby comes to 1000/4 = 250 W/m2
This figure already accounts for the diurnal and latitude factors on the capacity factor, and is an average (so not to be used for a specific location, just as a way to get a feel for the scale of solar required).
Assume we capture this energy with solar PV. We do have to consider the efficiency of solar PV, which we will take as 25% (much better than nature, by the way, which can only manage about 5% efficiency, with photosynthesis in leaves).
So we’d get 250 x 0.25 = 62.5 W/m2 effective generation on average.
Using a 40 TW requirement by 2050 (about 3 times current power demand) would equate to (40,000,000,000,000 / 62.5) m2 = 4000 x 1010 / 62.5 m2 = 64 x 1010 m2 = 64 x 104 km2
= 800 km x 800 km which is a 800 km sided square.
Note that if we take habitable land on Earth (excluding deserts, rocky ground, cryosphere, etc.) it amounts to roughly 100 million km², so the land required for PV is about 0.6% of this habitable land.
Some have suggested that humanity should aim to achieve a ‘2kW society’ (2kW of power for every human). If the world’s population stabilises at 10 billion people, that would then imply a power demand of 20 TW. This is half of what Niele quoted in his 2005 book. This could be rationalised due to the energy savings that come from electrification of society and the efficiencies of end-use, which more than compensate for increases in useful energy demand. We might then regard a 800 km square as an upper limit on land area required.
If we divided this up into 10,000 squares globally, each would have an area of 64 x 106 m2, and so each would be a 8 km sided square, which would be easily achieved. Where solar is not feasible at high latitudes, we can simply substitute solar PV with wind turbines, which also source their energy from the Sun.
B. TV on Standby versus overfilling your kettle
EU/UK Eco-design standards cap TV standby power at 0.5W, so on standby it would take 2000 hours, or over 83 days, to consume 1 kWh of energy.
Now to boil 400 ml water, a typical mug of tea volume, that starts at 10°C, takes 0.0418 kWh.
This comes from the formula:
Energy = mass x heat-capacity x temperature-change
= 0.4kg x 4.184 kJ/kg.°C x (100-10) °C
= 150.6 kJ
= 150.6 kWs
= 150.6 / (60×60) kWh
= 0.0418 kWh
Assuming the kettle loses some energy, so is 80% efficient, we would need a bit more, say about 0.05 kWh of electricity to boil a mug’s worth of water in a kettle.
Now let’s assume you live alone and boil the kettle 4 times a day for mugs of tea or coffee, but you put in enough water for 2 mugs each time when you only need one. You’d be wasting 4 x 0.05 = 0.2 kWh a day. Over 83 days that would amount to 166 kWh, which is 166 times as much as the TV on standby over the same period.
It is interesting how often people get anxious about minuscule contributions to their energy use (like modern TVs on standby), while ignoring much greater contributions (such as over filling kettles), or enormous contributions (like the wasted energy when burning fossil fuels in cars).
I’m not ignoring that small actions can lead to larger actions, and so on, getting to really significant actions. We see this work very well in areas such as waste, particularly food waste, where it is more obvious. The risk though is that often people get stuck at the very small actions to settle their anxiety, but then stop there.
I’d recommend Mike Berners-Lee’s book How Bad Are Bananas? to help navigate the issue of carbon footprint of everyday things and actions. It’s difficult to get reliable numbers, particularly when there are opaque supply chains, but he’s done the hard work for us.
C. Public Acceptance versus Unit Costs of Power Sources
LCOE sources: Onshore wind & solar — Arup/DESNZ (Oct 2025); Offshore wind — AR7a CfD strike price (Feb 2026); Nuclear — HPC CfD £92.50/MWh in 2012 prices inflated to 2025 prices (NAO 2017/DESNZ); Imported gas CCGT — DESNZ Electricity Generation Costs 2025 at 30% load factor; Shale gas* — estimated from Cronshaw & Grafton, Applied Energy 215 (2018), upper-range breakeven via CCGT; no UK commercial production data exists.
Public acceptance sources: Solar, offshore wind, onshore wind, nuclear, gas, shale — YouGov/DESNZ PAT 2024–25 (% favourable).
North Sea (G): 56% reflects those disagreeing that the UK should produce less of its own oil and gas (DESNZ PAT Summer 2025, Fig 3.4) — a double-negative framing measuring energy security pragmatism during the transition rather than active endorsement of new field development. The same survey shows 82% wanting more investment in alternatives, consistent with support for a managed transition rather than abrupt cessation of domestic production.
Note on curtailment and wind LCOE: CfD strike prices reflect project-level LCOE at expected capacity factors but exclude whole-system curtailment costs. In 2024/25, transmission constraints cost £1.9bn (NESO/Modo Energy 2026), of which 76% were payments to gas generators to replace curtailed wind (RenewableUK 2025) — a cost of grid infrastructure underinvestment rather than of wind generation itself. It would therefore be misleading to load these system-wide costs onto wind LCOE; the appropriate remedy is grid expansion (Eastern Green Links etc.). Without upgrades, curtailment costs are projected to reach £4–8bn annually by 2030, falling substantially once transmission upgrades complete.
D. New Car Registrations versus Running Costs
Monthly cost: lease + fuel/charging + maintenance at 10,000 miles/year, home charging assumed for EV. 2021: LeasePlan Car Cost Index 2021; petrol ~125p/litre; home charging ~15p/kWh. 2026: Octopus EV/Leasing.com median lease (May 2026): EV £369/mo, petrol £409/mo; petrol ~157p/litre (RAC); home charging ~25p/kWh (Ofgem cap). Acceptance — EV: 2021 estimated ~28% (EY Mobility Consumer Index 2021: 41% preference; Deloitte 2021: ~10% stated next-purchase intent — midpoint used); 2026: 25% likely to buy (YouGov/ChargeUK, July 2026). Acceptance — petrol: 2021/2026 estimated from complement of EV preference and new registration share trends (SMMT). Note: EV ‘likely to buy’ rises to 37% if public charging cheaper than petrol (YouGov/ChargeUK 2026). Salary sacrifice excluded — reduces effective EV monthly cost by 30–40% for employees.
E. Heating the UK with Heat Pumps or Green Hydrogen
Recall what I said in the section what is energy?
“when we transform from one kind of energy to another, say from solar to electricity, or from electricity to green hydrogen, there will be losses, and it’s really important to keep account of those losses when considering the economics of different sources and end-uses of energy.”
Green hydrogen for heating is a case in point. In the referenced article25, Professor Cebon includes a figure showing the cumulative conversion losses and how it would take:
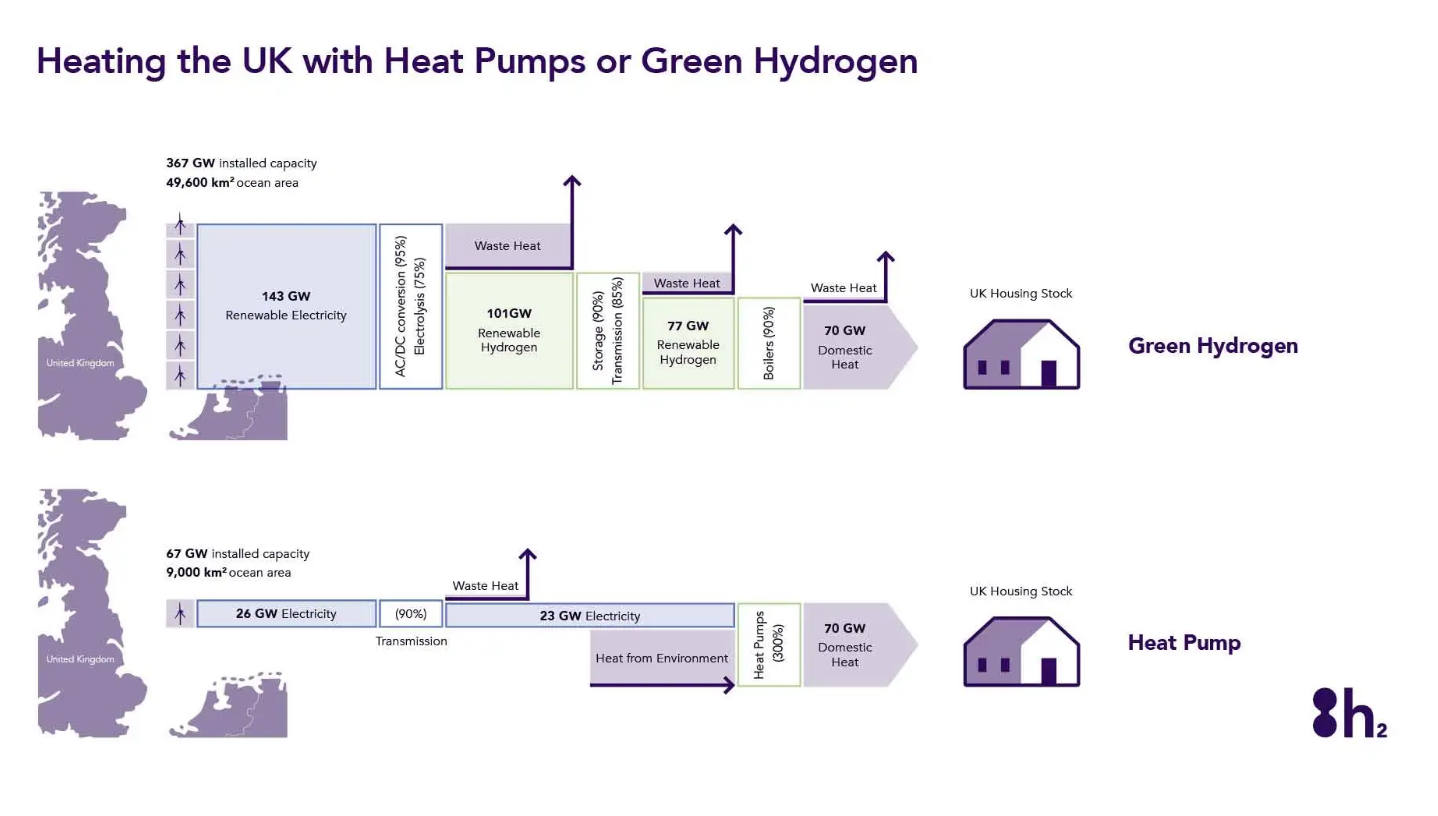
We see we’d need 143 GW of renewables electricity to heat homes with Green Hydrogen, compared to 26 GW if we used the electricity directly in heat pumps (and that is using a pessimistic coefficient of performance for heat pumps of 3.0 and optimistic one for boilers of 90%). That would mean building 5.5 times as many wind turbines than required to heat homes.
That would be a monumental waste of money, just to satisfy the hydrogen lobby.
It is almost always the case that flawed arguments on energy are rooted in a failure to account for conversion losses, and the Primary Energy Fallacy discussed earlier is another example.
THE END