This essay is published on my blog EssaysConcerning.com, and is the basis for a talk I give by the same title. It provides a guide to global warming in plain English while not trivialising the subject. It avoids technical terms & jargon (like ‘forcing’) and polarising or emotive language (like ‘denier’ or ‘tree hugger’). My goal was to give those who attend the talk or read this essay a basic foundation on which to continue their own personal exploration of this important subject; it provides a kind of ‘golden thread’ through what I believe are the key points that someone new to the subject needs to grasp. References, Further Reading, Notes and Terminology are included at the end of this essay. Slides from the talk, including some bullet points, are included in the essay to provide summaries for the reader.
I am Richard Erskine and I have a Doctorate from Cambridge University in Theoretical Chemistry. In the last 27 years I have worked in strategic applications of information management. Quite recently I have become concerned at the often polarised nature of the discourse on global warming, and this essay is my attempt to provide a clear, accurate and accessible account of the subject. I will leave the reader to judge if I have been successful in this endeavour.
Published July 2015 [Revised March 2016].
Contents
1. The role of Carbon Dioxide (CO2)
2. Ice Ages and Milankovitch Cycles
3. How do we know this history of the Earth?
4. How do we know there is warming occurring and that it is man-made?
5. What are the projections for the future?
6. Can mankind stay within the 2oC goal?
7. Is international agreement possible?
8. Planning a path to zero carbon that supports all countries
9. The transformation to a zero carbon future
This essay is about Global Warming, past, present and future, man-made and natural, and about our human response to the risks it poses. It starts with a historical perspective on the wider subject of climate change (See Further Reading – Spencer Weart, The Discovery of Global Warming).
In the early 19th Century people realised that there had been geological changes due to glaciers, such as large rocks deposited in valleys. By 1837 Louis Agassiz (1807-1873) proposed the concept of ice ages. We now know that there were 4 major ice ages over the past 400,000 years. Between each ice age are periods called inter-glacials. In the deep history of our 4.5 billion year old planet there were other periods of cooling and warming extending back millions of years.
1. The role of Carbon Dioxide (CO2 )
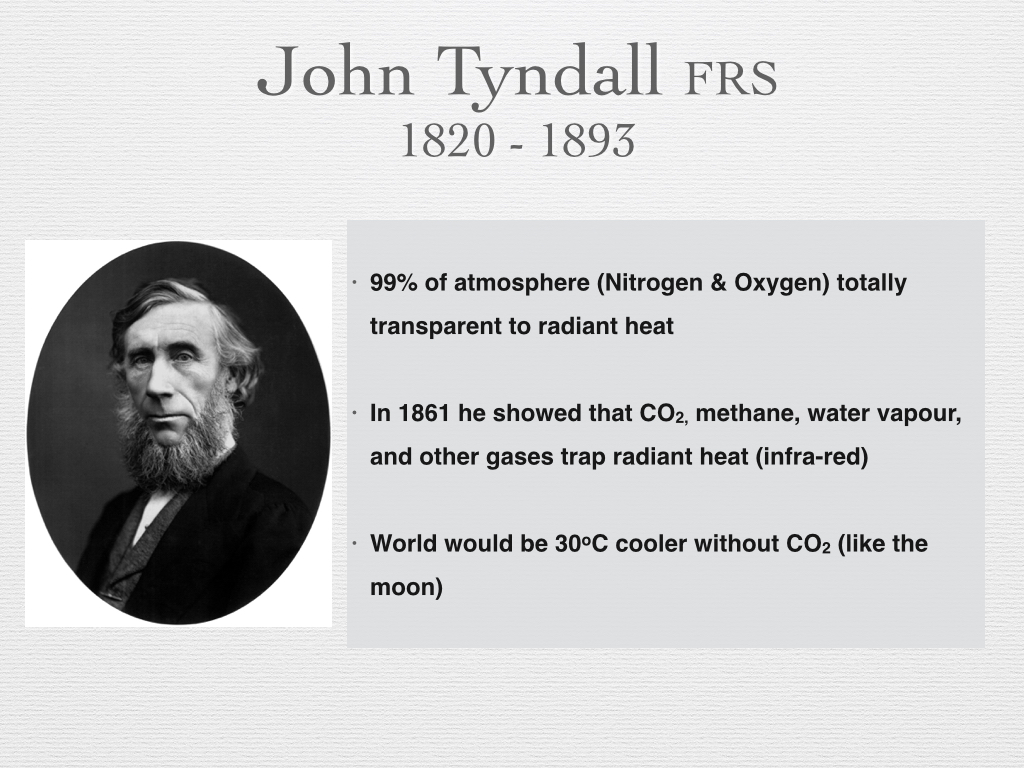
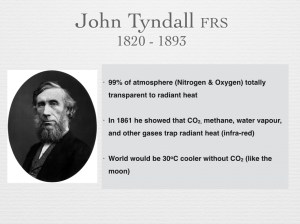
John Tyndall (1820-1893) was a highly respected scientist who loved to holiday in the Alps and wondered what had caused the ice ages. In 1861 he published a paper that was key to our modern understanding (Reference 1).
He showed that carbon dioxide (as we now call it) and water vapour, amongst others, were very effective at trapping the radiative heat (what we call infra-red radiation). Infra-red radiation is emitted from the surface of the Earth when it is heated by visible radiation from the Sun.
The Nitrogen, Oxygen and Argon that together make up 99% of the Earth’s atmosphere are completely transparent to this infra-red radiation. So, while carbon dioxide made up only 0.028% of the atmosphere, with water vapour adding variable levels of humidity, they were thereby recognised 150 years ago as being responsible for trapping the heat that makes the Earth habitable for humans. We call these gases ’greenhouse gases’.
Consequently, the Earth is 30oC warmer than would be the case in the absence of greenhouse gases (on average 15oC, as opposed to -15oC) [see Note 1]
Understanding how so-called ‘greenhouse gases’ absorb infra-red radiation and heat the atmosphere is well established textbook physics, but does get a little technical. Nevertheless, there are plenty of very good resources that are very helpful in explaining this [see Note 2].
2. Ice Ages and Milankovitch Cycles
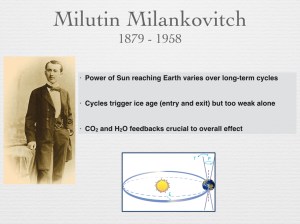
But this still begged the question: what triggered the ice ages? Our modern understanding of the ice ages is informed by two hundred years of scientific research, and the accumulation of knowledge and insight. Milutin Milankovitch (1879-1958) was a Serbian mathematician and astronomer who calculated the cyclical variations (“Milankovitch Cycles”) in the Earth’s orbit and orientation which impact on the intensity of the Sun’s rays reaching polar and other regions of the Earth. His goal was to explain climatic patterns. It was only in the 1970s that Milankovitch Cycles were widely accepted as playing a key role as triggers for entering and leaving an ice age.
The explanation is as follows. Some change starts the process of cooling that takes us into an ice age. The most probable trigger is the start of one of the periodic variations in the orbit and orientation of the Earth. The timing of these cycles correlates well with the ice ages. The greater seasonality of the northern hemisphere (due to its proportionally greater land mass) was a significant factor in promoting growth of the ice sheets.
While these changes were insufficient to explain the full cooling required, they provided the trigger [see Note 3]. After this initial cooling there would have been more snow and ice sheet growth, with the Earth reflecting more light. Overall the resulting cooler Earth system would have been better at capturing carbon dioxide over these timescales [see Note 4]. Since cooler air is less humid, there would also have been less water vapour in the atmosphere.
Overall, the reduction in greenhouse gases in the atmosphere would have led to further cooling. This negative feedback process continues, step by step, leading to a new equilibrium where the temperature dropped by a few degrees, the ice sheets grew towards their peak volume, and the sea levels fell accordingly [see Feedback in Terminology].
The exit from an ice age is the reverse of this process. There would have been a trigger that brought slight warming, during an alternate phase of a Milankovitch Cycle. Reductions in snow cover and retreating ice sheets meant less light was reflected, leading to another increment of warming.
Then some carbon dioxide would have been released from the oceans, leading to further warming. This slight warming led to increased humidity [see Note 5], which is a positive feedback effect, and this led to additional warming, which in turn led to the release of more CO2 from the oceans, which led to further warming.
This positive feedback process would have led to a progressively warmer planet and eventually a new equilibrium being reached [see Note 6] in an interglacial period such as the one we are living in.
3. How do we know this history of the Earth?
Since the 1950s ice cores (see photo below) have been drilled into the great ice sheets of Greenland and Antarctica that together hold 99% of the the Earth’s ice. The techniques used to analyse these ice cores have been advanced so that we are now able, since the 1980s and 1990s, to look back over these 400,000 years with increasing precision, across the timescale of 4 major ice ages. The Vostok ice cores in the late 1990s reached back 420,000 years. The EPICA cores drilled through the thickest part of the Antartica ice sheet reaches back 800,000 years. In Greenland, the NEEM ice core reaches back 150,000 years.
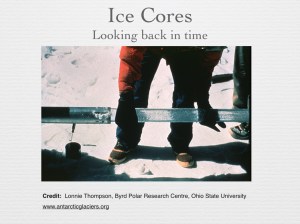
Scientists have literally counted the successive years of compressed snow fall manifest within the ice sheets. By looking at the bubbles of air and materials trapped in these ice cores scientists can determine the concentration of carbon dioxide and other gases over this period.
They can also measure the global temperature that would have existed over the same period through an ingenious measurement of isotopic ratios, as first suggested in 1947 (Reference 2) by the chemist Harold Urey (1893-1981). The story of these ice cores has been told very well by Professor Richard Alley [Alley, Further Reading]
Oxygen’s most common isotope is Oxygen-16 (16O), wherein the nucleus is composed of 8 protons (the defining attribute of the element Oxygen), and 8 neutrons. The next most common stable isotope of oxygen is Oxygen-18 (18O) which has extremely low abundance compared to 16O. 18O has 2 extra neutrons in the nucleus, but is chemically identical.
Water is H2O and when a molecule of it evaporates from the ocean it needs a little kick of energy to break free from its liquid state. The small percentage of 18O-based water in the atmosphere varies in a way that is related to the temperature of the atmosphere that Urey calculated. So when the moisture in the air is mixed and later gathers as clouds and turns to snow that falls in Greenland and Antarctica, it leaves an indicator through its 18O content, of the average temperature of the atmosphere at that time.
Ice core evidence is being gathered and checked by many independent teams from many countries at different locations, and there are other independent lines of evidence to back up the main conclusions.
For example, there are the loess layers in the sediment of lakes that can be analysed using analogous techniques, with isotopes of other elements, to provide indicators of temperature over different periods . Some of these methods can look back in time even further than the ice cores, by looking at ancient shells in the ocean sediments, for example.
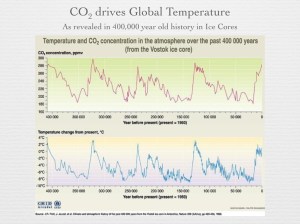
By analysing the ice cores up to 2 miles deep, scientists can look back in time and measure the CO2 concentration and the temperature, side by side, over several ice ages. Above is a presentation of the data from the seminal Petit et al 1999 paper in Nature (Reference 3), derived from ice cores retrieved from Antarctica. These ice core projects were epic undertakings.
What this shows is a remarkable correlation between carbon dioxide concentrations and temperature. The studies from Greenland in the Northern Hemisphere and Antarctica in the Southern Hemisphere reveal a global correlation.
Because the initial trigger for exiting an ice age would have been a Milankovitch Cycle related to the orbit and orientation of the Earth, the subsequent release of CO2 slightly lagged the change in temperature, but only initially (see Note 7). As previously described, the increased CO2 concentrations and the subsequent positive feedback generated by water vapour provided the principal drivers for the global warming that took the Earth into an interglacial period.
Within the glacial and interglacial periods changes occurred that reflected intermediate fluctuations of warming and cooling. These fluctuations punctuated the overall trends when entering and leaving an ice age. This was due to multiple effects such as major volcanic eruptions.
For example, the Tambora volcanic eruption of 1815 “released several tens of billions of kilograms of sulphur, lowered the temperature in the Northern Hemisphere by 0.7oC” (Page 63, Reference 4). This led to crop failures on a large scale and a year without a summer that inspired Lord Byron to write a melancholy poem. This was a relatively short lived episode because the sulphur aerosols (i.e. droplets of sulphuric acid) do not stay long in the upper atmosphere, but it does illustrate the kinds of variabilities that can be overlaid on any long-term trends.
Another major actor in long-term internal variability is the world’s great ocean conveyor belt, of which the gulf stream is a part. This brings vast amounts of heat up to the northern Atlantic making it significantly warmer than would otherwise be the case. There are major implications for the climate when the gulf stream is weakened or, in extremis, switched off.
On shorter timescales, the warming El Niño and cooling La Niña events, which occur at different phases in the equatorial Pacific every 2 to 7 years, add a significant level of variability that has global impacts on climate.
These internal variabilities of the Earth system occurring over different timescales ensure there is no simple linear relationship between CO2 and global temperature on a year by year basis. The variations ensure that as heat is added to the Earth system and exchanged between its moving parts, the surface atmospheric response rises on a jagged curve.
Nevertheless, overall CO2 can be clearly identified as the global temperature ‘control knob’, to borrow Professor Richard Alley’s terminology. The CO2 concentration in the atmosphere is the primary indicator of medium to long term global temperatures trends, in both the lower atmosphere and the upper ocean.
Over the period of the ice ages, the concentration of CO2 in the atmosphere has varied between about 180 parts per million (ppm) and 300 ppm. So, less than a doubling or halving of CO2 concentrations was enough for major changes to occur in the Earth’s climate over hundreds of thousands of years.
As the ice cores have been studied with greater refinement it has been realised that in some cases, the transitions can be relatively abrupt, within a few decades, not the thousands of years that geologists have traditionally assumed, suggesting that additional positive feedbacks have come into play to accelerate the warming process.
4. How do we know there is warming occurring and that it is man-made?
We know from the physics of CO2 in the atmosphere and the way that heat is accumulating in the Earth’s system as concentrations rise (with over 90% of the extra heat currently being deposited in the upper oceans, Reference 5). Satellite and ground measurements confirm the energy imbalance.
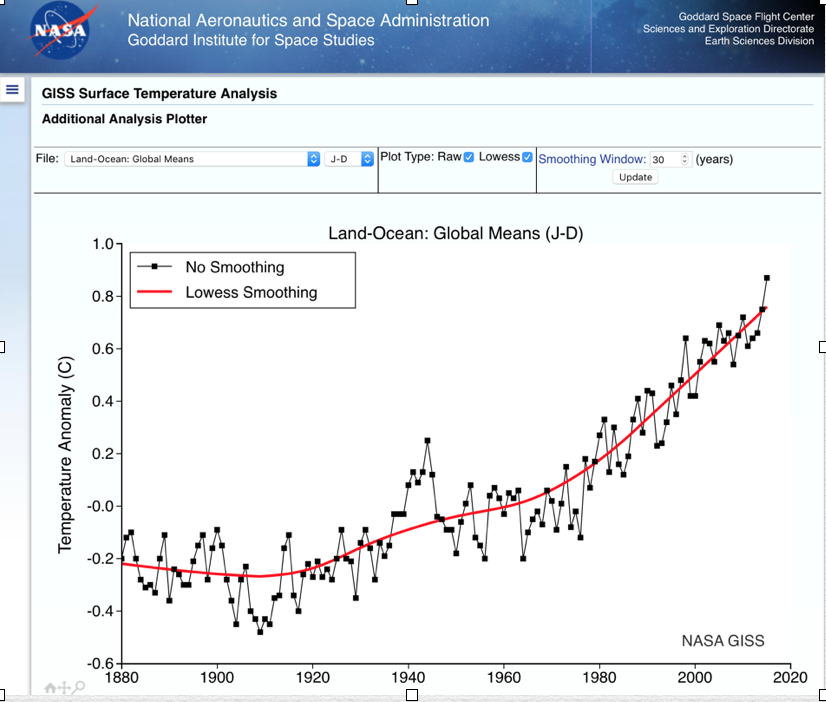
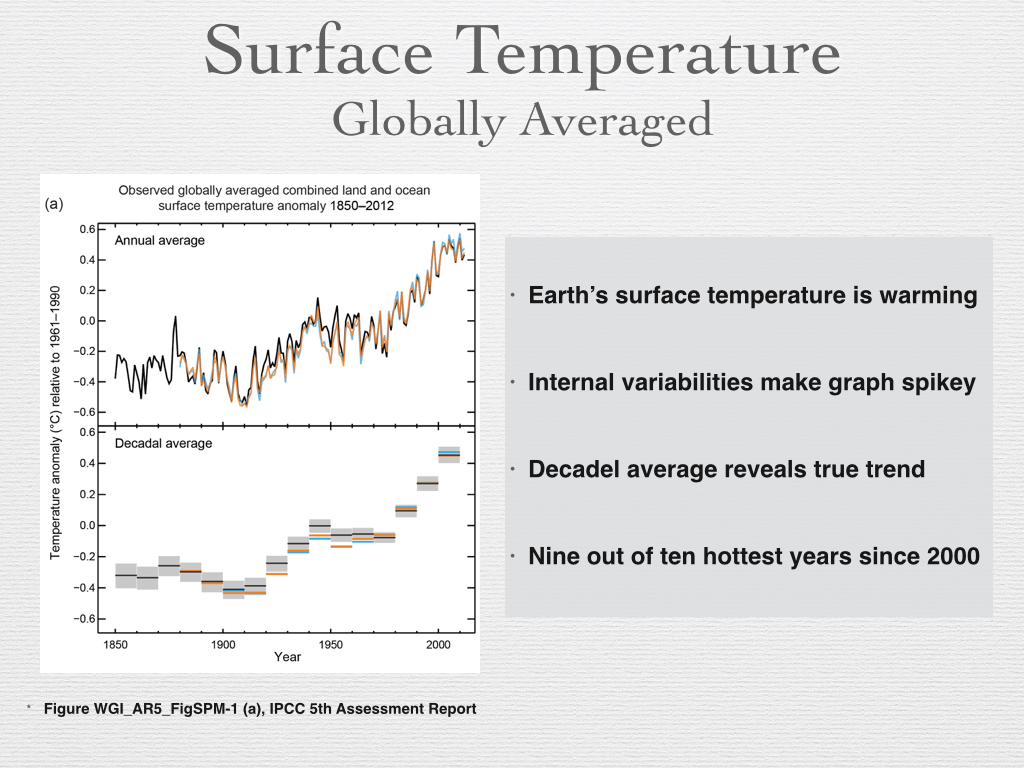
Rising temperature in the atmosphere, measured over decadal averages, is therefore inevitable, which indeed is what is found (Reference 6): the Intergovernmental Panel on Climate Change (IPCC) included published data based on the globally averaged temperature from instruments around the globe (illustrated below). The Annual Average is very spiky, due to short-term variabilities as discussed.
Each year is not guaranteed to be hotter than the previous year, but the average of 10 consecutive years is very likely to to be hotter than the previous 10 year average, and the average of 30 consecutive years is almost certain to be hotter than the previous 30 year average. The averaging smooths out those internal variabilities that occasionally obscure the underlying trend.
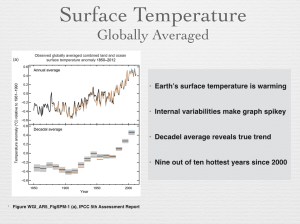
Nine of the ten hottest years in the instrumental record since 1884 have been in the 21st century, with 1998 being the one exception because of a large El Niño (Reference 7). Update: it is now 15 of the 16 hottest years in the instrumental record that have been since the year 2000 (Reference 8).
Many people have asked whether or not variations in solar output could be causing the warming, or maybe CO2 from volcanoes, but as discussed below these do not explain the warming.
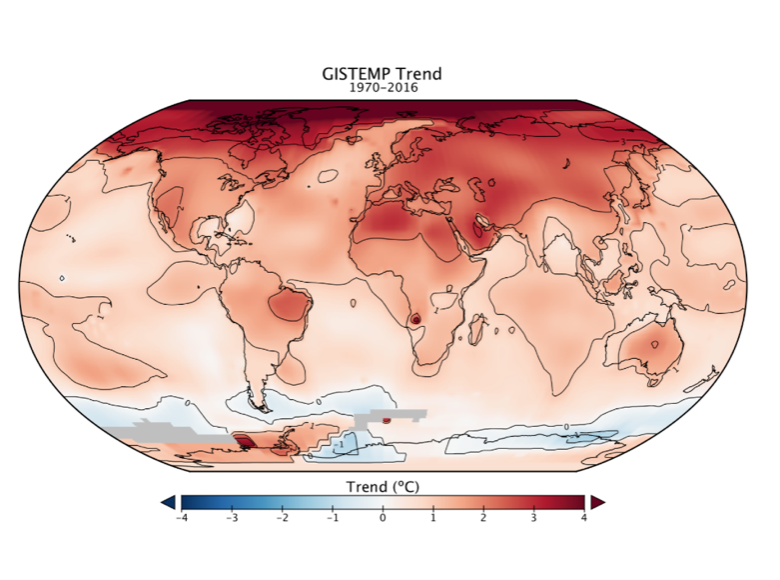
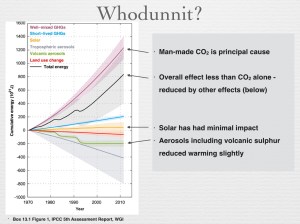
Below we show a Figure from the IPCC that shows the various contributions to the warming of the Earth system (Box 13.1 Figure 1, References 6) during the period 1970 to 2011. The cumulative energy flux into the Earth system resulting from the influence of various sources is shown as coloured lines: well mixed and short lived greenhouse gases; solar; aerosols in lower atmosphere (tropospheric); volcanic aerosols (relative to 1860–1879). These are added to give the cumulative energy inflow (black) [see also animation of the data at Reference 9]
What this shows is that the greenhouse gases, principally man-made CO2, have been the predominant contributor to warming, with changes in solar output having a minimal cooling effect. Volcanic and other aerosols have been significant but their effect was to reduce the net warming.
Excellent summaries of the IPCC findings are available [see References 10 and 11].
As we can see, the Sun’s output has been quite stable, and volcanoes in recent decades have only produced between 0.5% and 1% of the additional CO2 to be accounted for. This is to be contrasted with over 99% of the additional CO2 coming from man-made sources. This assessment is also confirmed by analysing the tell-tale mix of isotopes of carbon in the atmospheric CO2 which shows that most of it must have come from the combustion of fossil fuels, rather than volcanoes.
Volcanoes, through their injection of aerosols (namely, droplets of sulphuric acid) into the atmosphere are actually doing the reverse – creating a cooling effect that is slightly reducing the net global warming.
Since 1958 the concentration of CO2 in the atmosphere has been measured at Mauna Loa in Hawaii reliably thanks to Charles Keeling (1928-2005). The “Keeling Curve” is a great gift to humanity (Reference 12) because it has provided, and continues to provide, a reliable and contiguous measure of the CO2 concentration in our atmosphere. The National Oceanic and Atmospheric Administration (NOAA) in practice now uses data from many global sites.
The rate of that increasing CO2 is consistent with, and can only be accounted for, as a result of the human activities [see Note 8].
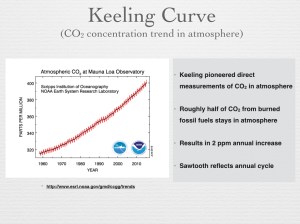
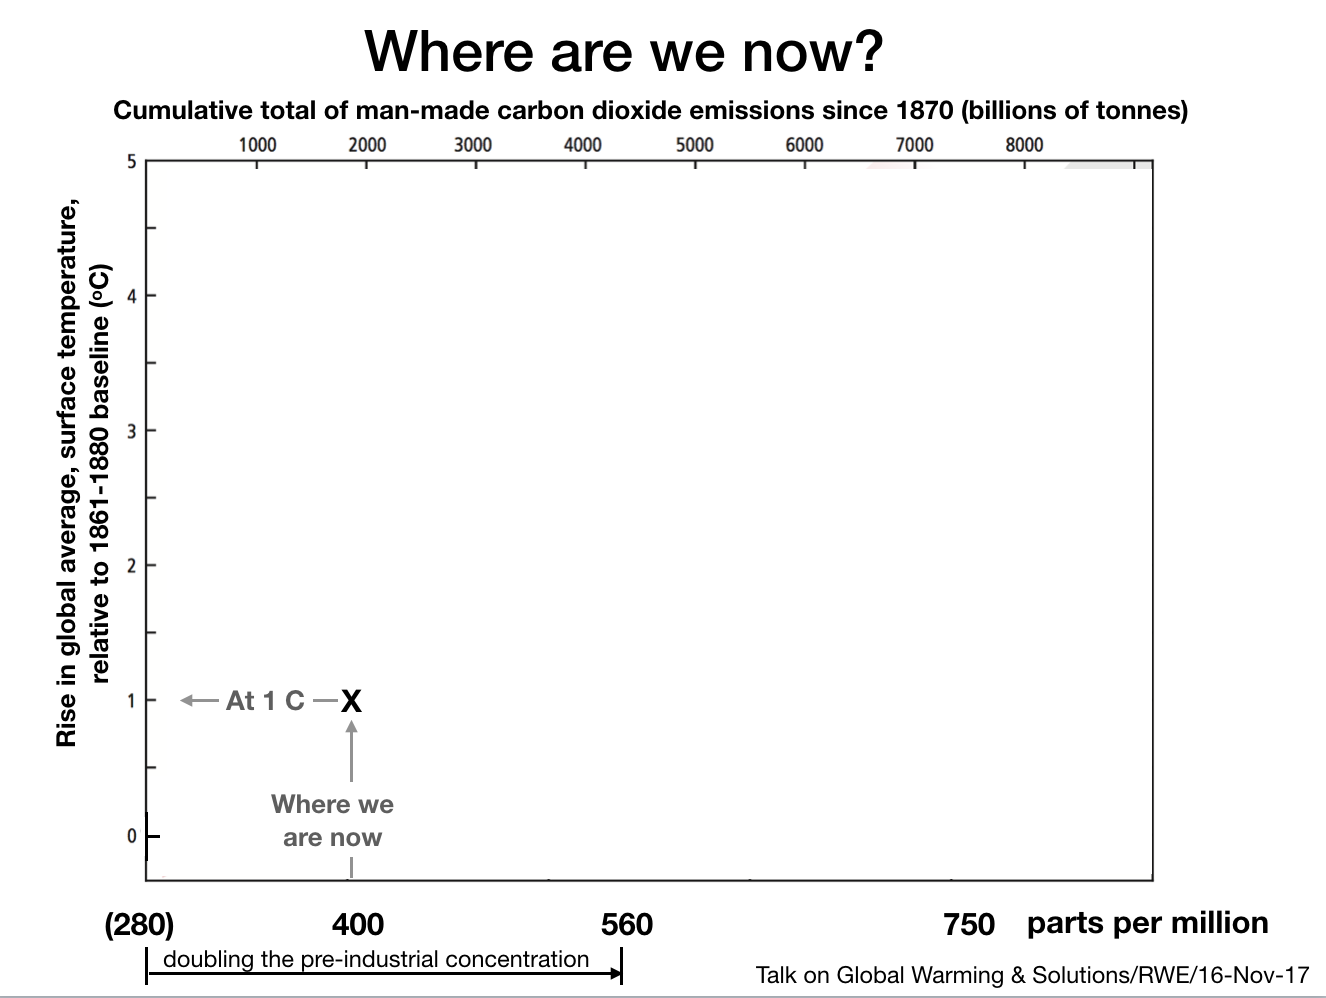
For the last one thousand years leading to the 20th Century, the concentration of CO2 was quite stable at 280 ppm, but since the start of the industrial revolution, it has risen to 400 ppm, with 50% of that rise in the last 50 years. An annual cycle is overlaid on the overall trend [see Note 9]. The Earth has not seen a level of 400 ppm for nearly 1 million years.
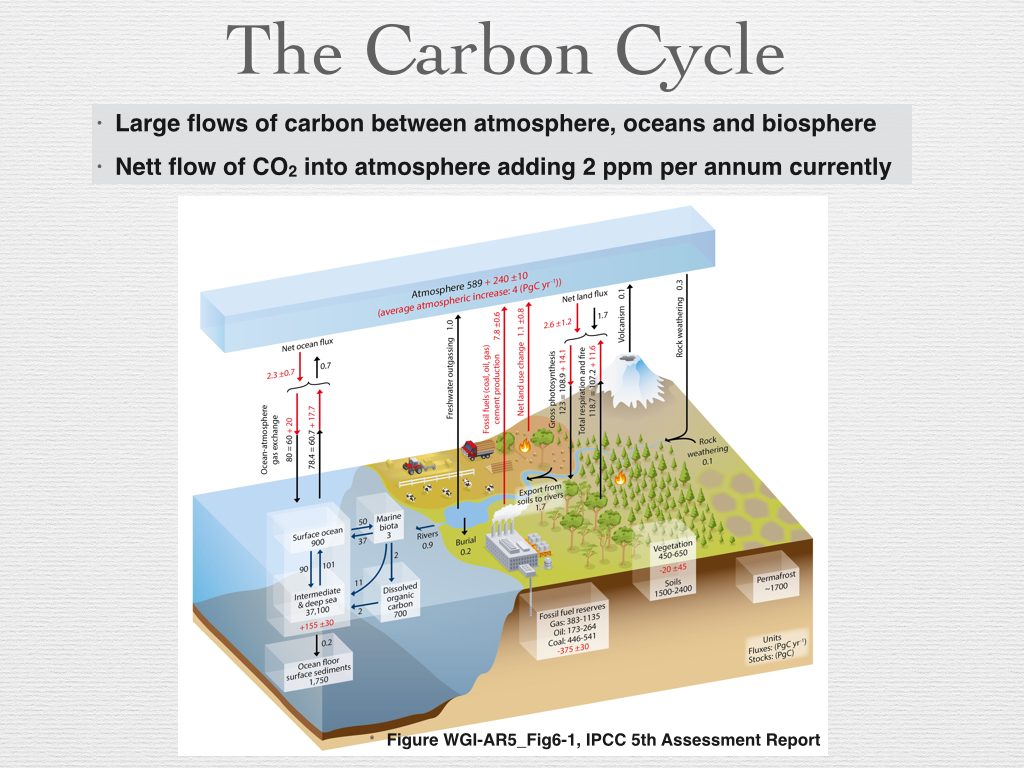
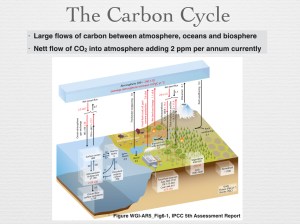
The carbon in the Earth system cycles through the atmosphere, biosphere, oceans and other carbon ‘sinks’ as they are called. The flow of ‘carbon’ into the atmosphere is illustrated in the following Figure (Reference 6). Man-made burning of fossil fuels causes a net increase in CO2 in the atmosphere above and beyond the large natural flows of carbon.
To understand this, an analogy used by Professor Mackay is useful (see Further Reading). Imagine an airport able to handle a peak of 100,000 in-coming passengers a day (and a balancing 100,000 out-going passengers). Now add 5,000 passengers diverted from a small airport. The queues will progressively grow because of a lack of additional capacity to process passengers.
Similarly, the CO2 in the atmosphere is growing. Humanity has hitherto been adding 2 ppm of CO2 to the atmosphere each year, and it is accumulating there [see Note 10]. This is the net flow into the atmosphere (but also with raised levels in the upper ocean in equilibrium with the atmosphere). Once raised to whatever level we peak at, the atmosphere’s raised concentration would take many thousands of years to return to today’s level by natural processes.
It is significant enough that the Earth has not had concentrations as high as 400 ppm for nearly 1 million years. But today’s situation is unique for an additional critical reason: the rate of increase of CO2 is unprecedented.
The IPCC is conservative in assessing additional incremental increases in atmospheric CO2 concentrations and other greenhouse gases on top of the human emissions, as a result of ocean and biosphere warming, but we are entering uncharted waters, which is why the current situation is so concerning.
5. What are the projections for the future?
In science and engineering computer models are used to understand the motions of billions of stars in galaxies; the turbulence of air flowing around structures; and many other systems. They are also used to help manage our societies. In our complex world models are used for the operational monitoring and management of all kinds of man-made and natural systems: our electricity networks; pathways of disease transmission; and in many other areas. When used to assess future risks, these models allow ‘what if’ questions to be posed (e.g. in relation to electricity supply, what if everyone puts the kettle on at half time?). This enables us to plan, and take mitigating actions, or adapt to impacts [These arguments are developed in more detail in a separate essay “In Praise of Computer Models”].
Given the high risks we face from global warming, it is essential we do the same here also. This is why so much effort has gone into developing models of the climate and, more broadly, the Earth system (including atmosphere, oceans, biosphere, land, areas of snow and bodies of ice).
These models have evolved since the 1950s and have become increasingly sophisticated and successful. While there is no doubt that the Earth is warming and that this is primarily due to man-made emissions of CO2, the models help society to look into the future and answer questions like ‘what if the level peaks at 500 ppm in 2060?’, for example. The models are a vital tool, and are continuing to evolve (Reference 13).
There are many questions that are not black and white, but are answered in terms of their level of risk. For example ‘what is the risk of a 2003-level heat-wave in Europe?’ is something that models can help answer. Increasingly serious flooding in Texas during May 2015 is the kind of regional effect that climate modellers had already identified as a serious risk.
In general, it is much easier for the general public to understand impacts such as flooding in Texas, than some abstract globally averaged rise in temperature.
Providing these assessments to planners and policy-makers is therefore crucial to inform actions either in supporting reductions in greenhouse gases (mitigation) to reduce risks, or in preparing a response to their impacts (adaptation), or both. It is worth stressing that mitigation is much more cost effective than adaptation.
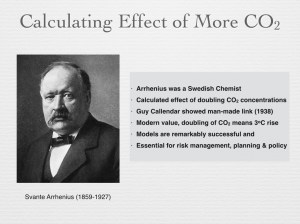
Svante Arrhenius (1859-1927) was a Swedish chemist who in 1896 published a paper on the effect of varying concentrations of CO2 in the atmosphere (Archer, Further Reading). He calculated what would happen if the concentration of CO2 in the atmosphere was halved. He, like Tyndall, was interested in the ice ages.
Almost as an after-thought he also calculated what would happen if the concentration was doubled (i.e. from 280 ppm to 560 ppm) and concluded that the global average temperature would rise by 6oC. Today, we call this an estimate of the Equilibrium Climate Sensitivity (ECS), or the estimate of the temperature rise the Earth will experience when it reaches a new equilibrium (see Note 11).
Guy Callendar (1898 – 1964) was the first to publish (in 1938) evidence for a link between man-made increases in CO2 in the atmosphere and increased global temperature. His estimate for ECS was a lower but still significant 2oC (Archer, Further Reading).
Since Syukuo Manabe (1931-) and Richard Wetherald (1936-2011) produced the first fully sound computer-based estimate of warming from a doubling of CO2 in 1967 (Archer and Pierrehumbert, Further Reading), and General Circulation Models (GCMs) of the climate have been progressively refined by them and others.
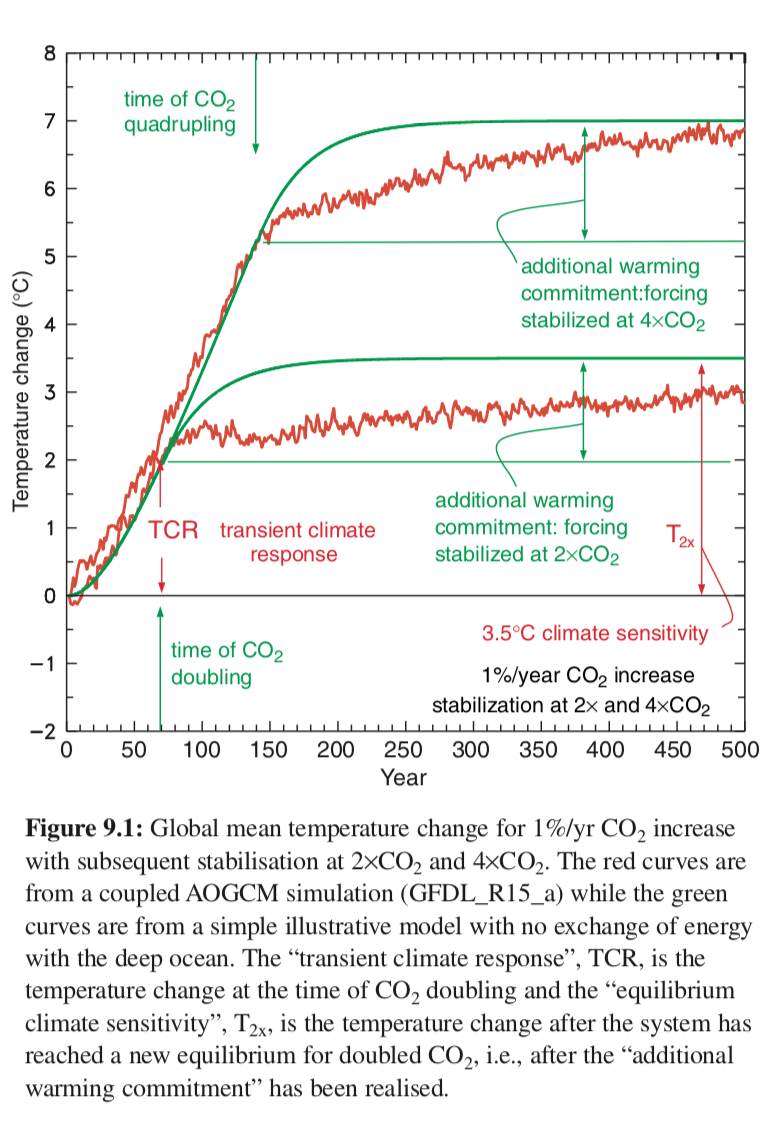
The modern ‘most likely’ value of ECS is 3oC, different to both Arrhenius and Callendar, neither of whom had the benefit of today’s sophisticated computing facilities. 3oC is the expected warming that would result from a doubling the pre-industrial CO2 concentration of 280 ppm to 560 ppm (Reference 6).
The ECS includes short and medium term feedbacks (typically applicable over a period of 50-100 years) which takes us to the end of the 21st century, but not the full effects of the longer term feedbacks associated with potential changes to ice sheets, vegetation and carbon sinks that would take us well beyond beyond 2100.
“Traditionally, only fast feedbacks have been considered (with the other feedbacks either ignored or treated as forcing), which has led to estimates of the climate sensitivity for doubled CO2 concentrations of about 3°C. The 2×CO2 Earth system sensitivity is higher than this, being ∼4–6°C if the ice sheet/vegetation albedo feedback is included in addition to the fast feedbacks, and higher still if climate–GHG feedbacks are also included. The inclusion of climate–GHG feedbacks due to changes in the natural carbon sinks has the advantage of more directly linking anthropogenic GHG emissions with the ensuing global temperature increase, thus providing a truer indication of the climate sensitivity to human perturbations.”
The so-called Earth System Sensitivity (ESS) is not widely discussed because of the uncertainties involved, but it could be as much as twice as large as the ECS according to the above quoted paper, and this would then be in the range of warming and cooling that was discussed earlier, in the record of the last 4 ice ages [see Note 12]. This is indicative of what could have occurred over these millennial timescales, and could do so again.
The key question we need to answer in the immediate future is: what pathway will the world follow in the next 50 years, in terms of its emissions and other actions (e.g. on deforestation) that will impact net atmospheric concentrations of greenhouse gases?
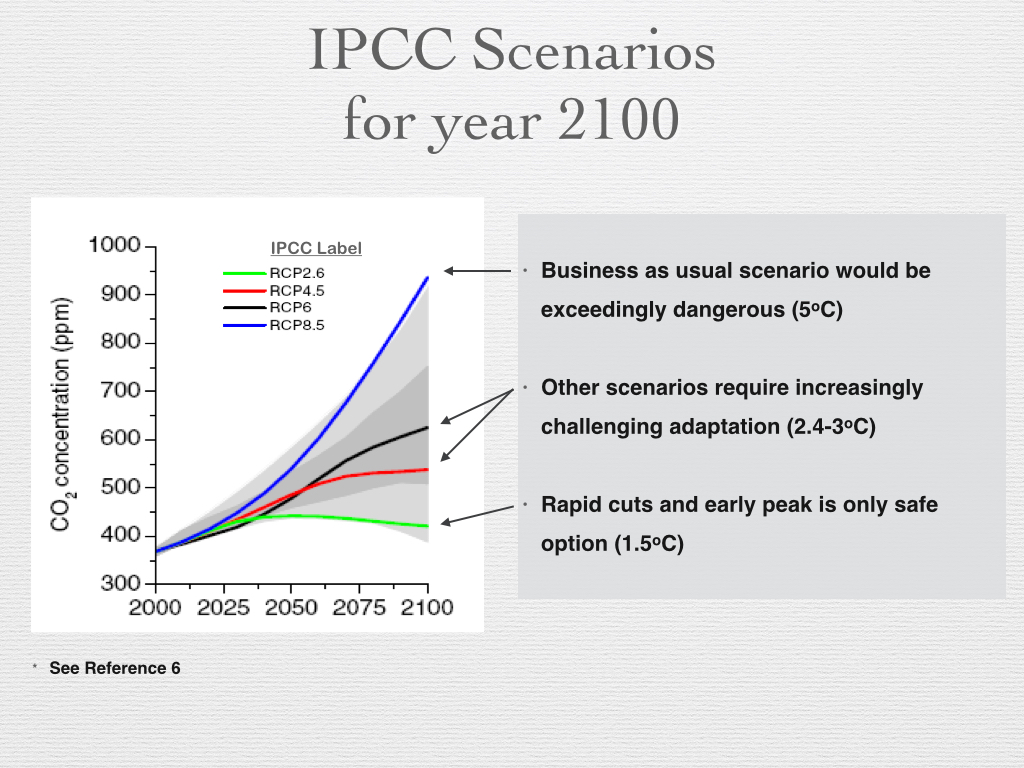
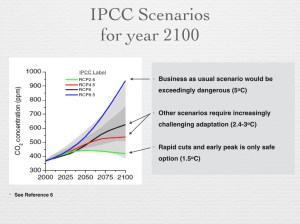
The IPCC 5th Assessment Report (AR5) included projections based on a range of different Representative Concentration Pathways (RCPs) leading up to 2100. Each RCP includes assumptions on, for example, how fast and how much, humanity will reduce its dependence on fossil fuels and on other factors like population growth and economic development (See Reference 15). The actual projections of future warming are dependent on what decisions we make in limiting and then reducing our emissions of CO2, because the lower the cumulative peak concentration the better, and the faster we reach a peak the better.
The following figure includes four of the IPCC RCPs. The one we shall call ‘business as usual’ would be extremely dangerous (many would use the word ‘catastrophic’) with a rise in the global average temperature of 5oC by 2100. It is not a ‘worst case’ scenario, because it is not difficult to envisage futures that would exceed this ‘business as usual’ scenario (e.g. much faster economic development with fossil fuel use increasing in proportion).
Only rapid and early cuts in emissions would be safe, leading to a peak in CO2 concentration by, say, 2030 (including some efforts to bring down concentrations after this using carbon capture and storage), leading to a 1.5oC rise by 2100.
The two other intermediate scenarios would be over the 2oC expected warming and would give rise to increasingly serious (and costly) interventions, with both short term and long term impacts.
The IPCC noted:
“There are multiple mitigation pathways that are likely to limit warming to below 2°C relative to pre-industrial levels. These pathways would require substantial emissions reductions over the next few decades and near zero emissions of CO2 and other long-lived greenhouse gases by the end of the century. Implementing such reductions poses substantial technological, economic, social and institutional challenges, which increase with delays in additional mitigation and if key technologies are not available. Limiting warming to lower or higher levels involves similar challenges but on different timescales.”
IPCC 5th Assessment Report, Summary for Policy Makers, SPM 3.4
Article 2 of the UN Framework Convention on Climate Change (UNFCCC), whose inaugural meeting was in Rio de Janeiro in 1992, stated the goal was to limit “greenhouse gas concentrations in the atmosphere at a level that would prevent dangerous anthropogenic interference with the climate system”, but formal recognition of the much cited 2oC target wasn’t until 2010 (Reference 16). There has been some debate whether the target should be lowered to 1.5oC, recognising the inherent dangers in the perception (or hope) that 2oC is a ‘safe’ limit we can overshoot with impunity.
A temperature trend has variabilities, as we have seen, over short to medium timescales because of several factors. These factors will continue to make themselves felt in the future.
Some people may seek comfort in the knowledge that there areas of uncertainty (e.g. level of impact at regional level), but as some wise person once observed, uncertainty is not our friend. The long-term future for our climate would take an extremely long time to unfold – to reach some new Earth system equilibrium – even if we stopped burning fossil fuels today. For example, the melting of the Greenland ice sheet could take many hundreds if not thousands of years.
Some changes are relatively fast and are already being felt as the planet warms, for example:
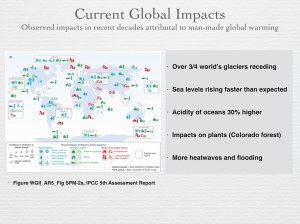
- About three quarters of the Earth’s mountain glaciers are receding at accelerating rates (Reference 17), putting fresh water supplies at risk in many places such as Peru and the Indian sub-continent. While some may say that we can fix this problem by desalinating sea water, as they do in the Middle East, and even power this using solar, as the Saudis are planning to do, this is clearly a massive extra burden on stressed global water resources that would require significant additional electricity capacity, and brings with it huge risks to natural and human systems.
- Sea levels are rising faster than expected and predicted to rise by up to 1 metre by 2100 (Reference 6). We could eventually see a rise of about 2.5 metres per 1oC rise in global surface temperature. So even if the world keeps to the 2oC commitment, we could anticipate a sea level rise of 5m eventually (Reference 18), putting at risk a majority of our cities that lie close to sea level today and where a growing percentage of the world’s population now resides (about 50% and growing). Note that while the IPCC scenarios focus on the state of the climate reached by 2100, in the longer term, changes could be locked in that have impacts for thousands of years (Reference 19).
- While a warmer climate can extend growing seasons in temperate zones, it can also bring problems for plants such as heat exhaustion, irrigation problems and increased range and resilience of insects. Outbreaks often defoliate, weaken and kill trees. For example, pine beetles have damaged more than 1.5 million acres of forest in Colorado, and this is attributed to global warming. The impact of temperature rise on food crops like wheat is expected to be negative overall, with yields likely to drop by 6% for every 1oC rise in temperature, according to a recent paper in Nature (Reference 20).
- The acidity of the oceans has increased by 30% since pre-industrial times (Reference 21). This is increasing every year with 2 billion tonnes of CO2 being added to the upper layer of the oceans. This is having an impact on corals but longer term it can impact on any creatures that form calcium carbonate to build skeletons or shells. Plankton underpin a large part of the marine food chain and are thereby threatened by increasing CO2.
The IPCC analysed the widespread impacts of global warming that are already being felt (the following graphic is from the IPCC report, but the bullets are the author’s summary of just a selection of impacts).
Plants and animals evolve over long periods, so sudden changes cannot be compensated for by equally rapid biological evolution.
The planetary system is mind-bogglingly complex, and has huge reservoirs of carbon in fossil fuels and even greater ones in the deep ocean, so it is a marvel how the combination of physical and biological processes has managed to keep the concentration of CO2 in the atmosphere remarkably stable for a long time.
The Earth, as James Lovelock famously observed, is like a living system. Without life, there would be little or no oxygen in the atmosphere. If there was much more than its current 21% contribution the atmosphere would be dangerously flammable, and if there were much less, we mammals would struggle to breathe.
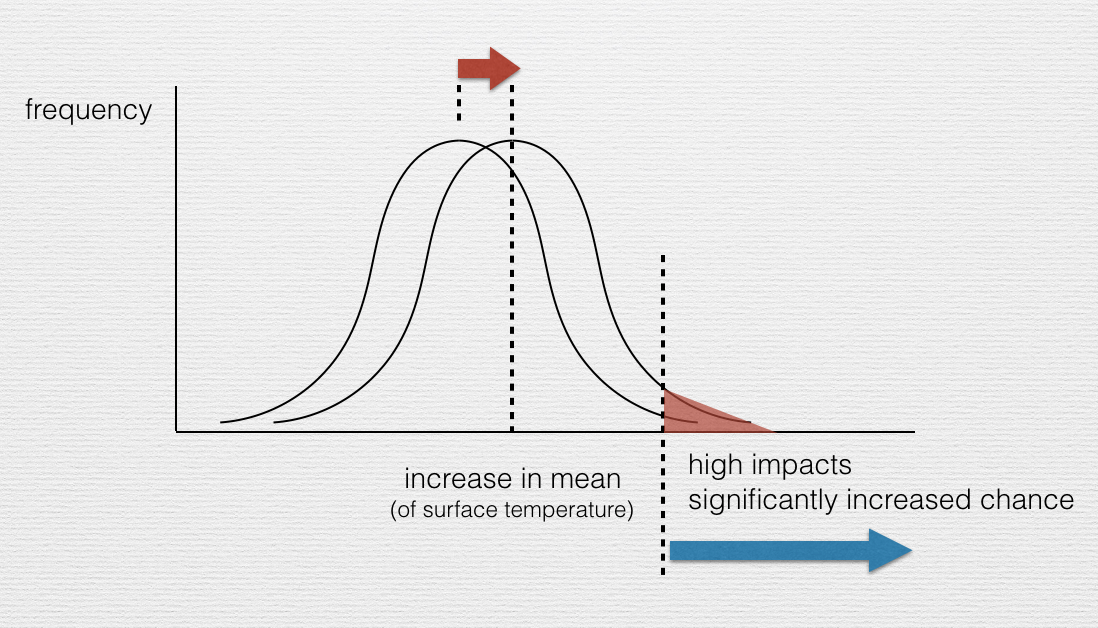
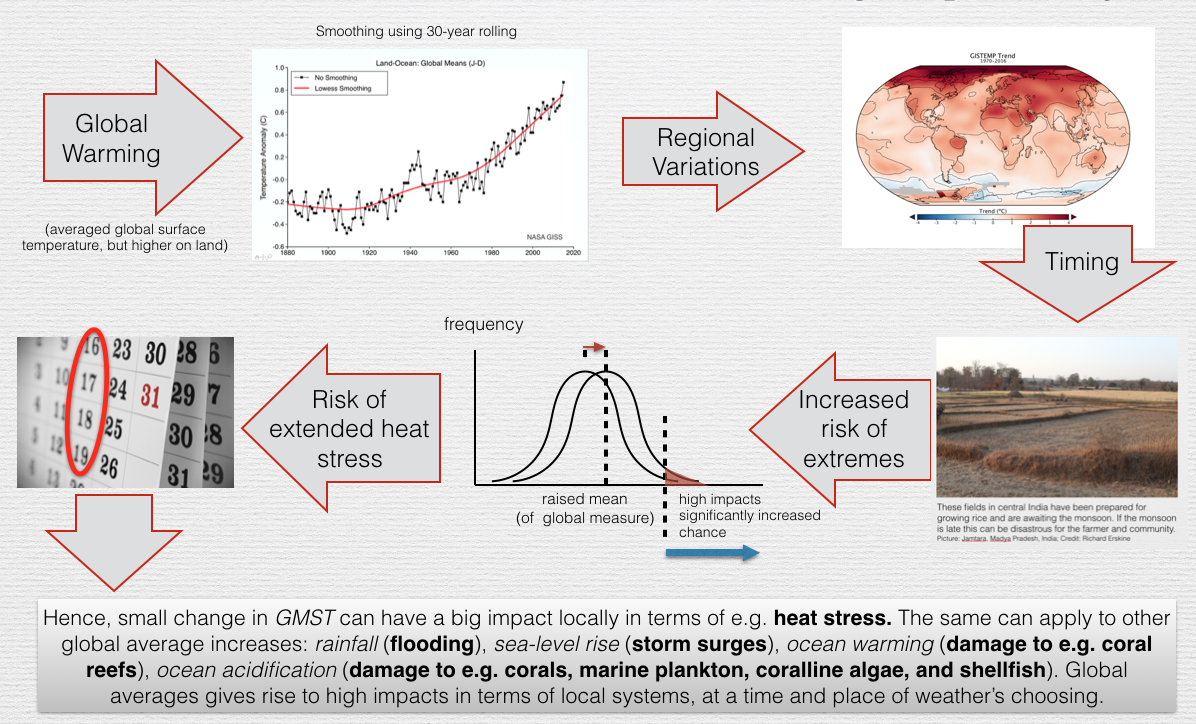
We see intricate balances in nature wherever we look in the biosphere and physical systems. That is why small changes can have big effects. You may wonder how an averaged global temperature change of 1oC or 2oC can have any significant effects at all.
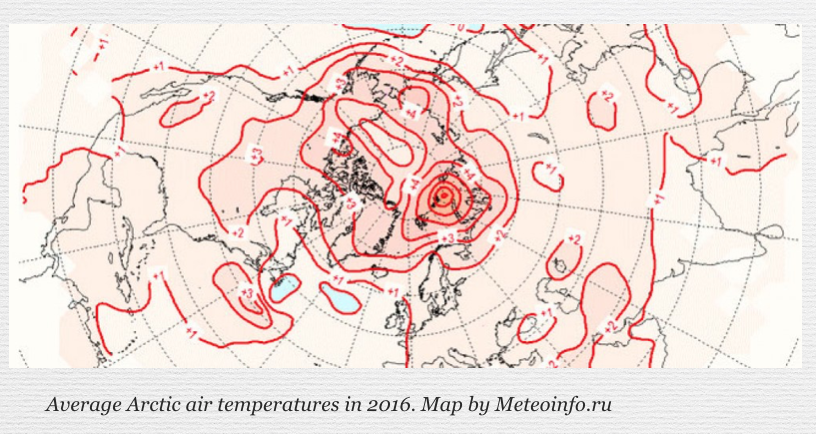
The first point to realise is that this is an average and it reflects much larger swings in temperature and also regional differences. The Arctic for example is warming at a faster rate than elsewhere, and also the lower atmosphere warms as the upper atmosphere cools: These are two effects long predicted by climate models (as far back as the crude models of the 1950s, long before these predictions were proven by satellite measurements).
One result of these changes in the Arctic is that the jet stream running below it is slowing and getting more wiggly. This wiggly jet stream can accentuate extremes and create phenomena like blocking highs that fix weather events for longer than normal. This is already leading to increased risks of extreme events after just a 0.8oC average global warming.
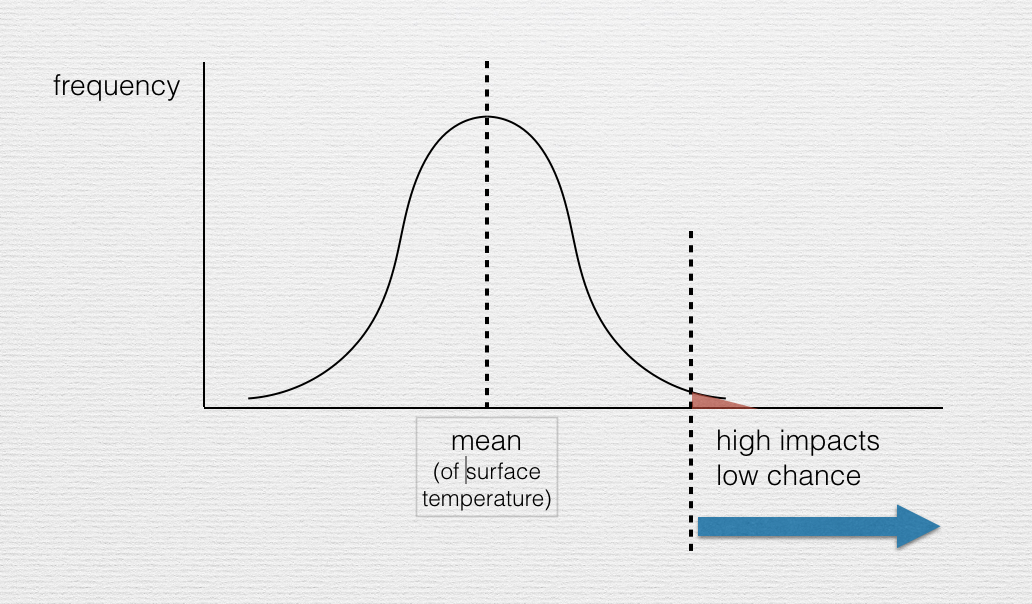
To illustrate what this might mean to western Europe and the UK, let’s look at heatwaves. When the average temperature is shifted a little higher, so are the extremes. What was very rare, becomes rare, and what was infrequent, can become quite frequent (Reference 22). Whilst a specific heatwave is not attributable to global warming, the odds mean that some are, and increasingly so as the average temperature increases. This perhaps obvious point is now backed up by research:
“The summer of 2003 was the hottest ever recorded for central and western Europe, with average temperatures in many countries as much as five degrees higher than usual. Studies show at least 70,000 people died as a result of the extreme high temperatures. In August alone, France recorded over 15,000 more deaths than expected for that time of year, a 37 per cent rise in the death rate. The same month also saw almost 2,000 extra deaths across England and Wales … While a heatwave used to happen once every 50 years, we’re now likely to see one every five years, the study concludes.” Robert McSweeney (References 23)
Similar increases in frequency could occur for other kinds of extremes like the flooding that hit Somerset in the UK during 2013-14. These regional impacts (current and projected) are being researched through ‘attribution studies’ by the UK’s Met Office, for example.
6. Can mankind stay within the 2oC goal?
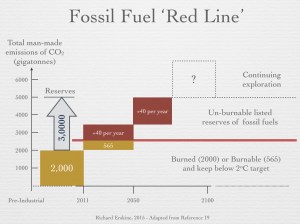
We as humans in just 150 years have emitted over 2,000 billion tonnes of carbon dioxide (abbreviated as 2,000 GtCO2) by burning fossil fuels buried for millions of years. On the back of the energy we have unleashed, we have achieved huge advances in nutrition, medicine, transport, industry and elsewhere.
To have good odds of avoiding going beyond the 2oC rise (compared to pre-industrial levels) that the nations of the world have committed to, the world should emit no more than 565 GtCO2 in the 40 years from 2010 to 2050 (References 24, 25, 26). This is a red line (otherwise called the ‘carbon budget’) that we should not cross.
There is an equivalent of 3,000 GtCO2 (emissions potential) in the known reserves for listed companies. At our current rate of over 40 GtCO2 (equivalent) emissions a year [see Note 13] we would reach the red-line by 2030. By 2050 we would be well beyond the red-line and would exhaust the reserves by 2075 [see Note 13, 14].
There are factors that will change the rate of emissions. Increasing consumption per capita in developing countries will increase the annual emissions if fuelled by carbon-based sources of energy. On the other hand, as countries transition to zero carbon sources of energy, there will be a trend to reduce emissions. This means that the ‘carbon budget’ may be spent over a shorter or longer duration. It is clearly a question of which of these two forces wins out over this period of transition.
However, the annual rate of CO2 increase during the four years up to 2015 has consistently exceeded 2 ppm, and in 2015 was about 3 ppm, as NOAA have reported. Clearly there is no sign yet of a levelling off of emissions globally.
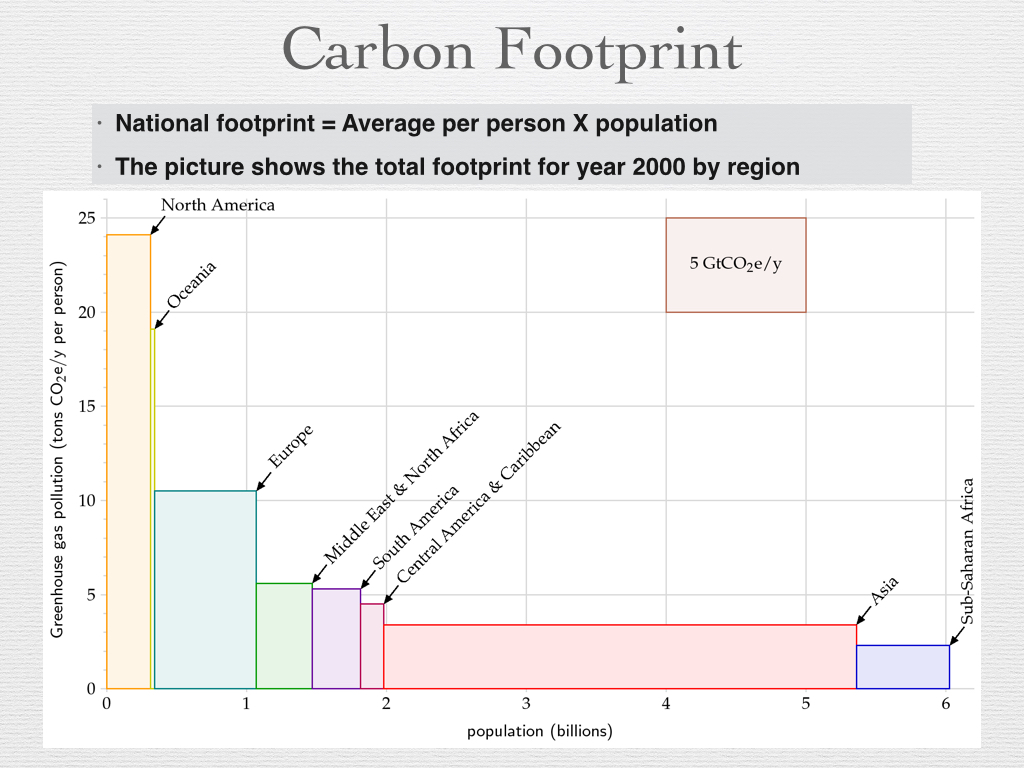
In the year 2000, the carbon footprint between the highest and lowest consumers differed by a factor of about 10. The USA was close to 25 tonnes of CO2 net emissions (equivalent) per person each year, compared to India, which was more like 2 tonnes (Mackay, Further Reading).
“Now, all people are created equal, but we don’t all emit 5½ tons of CO2 per year. We can break down the emissions of the year 2000, showing how the 34-billion-ton rectangle is shared between the regions of the world.”
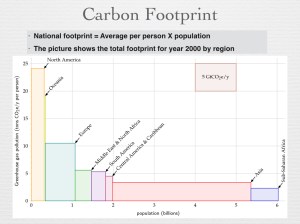
“This picture … divides the world into eight regions. Each rectangle’s area represents the greenhouse gas emissions of one region. The width of the rectangle is the population of the region, and the height is the average per-capita emissions in that region. In the year 2000, Europe’s per-capita greenhouse gas emissions were twice the world average; and North America’s were four times the world average.” (Professor David Mackay, Further Reading)
The above graphic (based on year 2000 data) is taken from Professor David Mackay’s book “Sustainable Energy without the Hot Air”. This book provides a clear approach to understanding our options and making the maths of energy consumption and supply stand-up to scrutiny: five different scenarios for reducing our carbon emissions are discussed to meet our energy needs.
It is also worth noting that research by Oxfam published in 2015 indicates that the top 10% of the world’s population are responsible for 50% of emissions, and that extreme carbon inequality exists around the world (Reference 27).
While much of the debate about ‘alternatives’ focuses on energy production (wind, solar, nuclear, etc.), consumption is an equally important topic. There is a need for radical reductions in consumption in order to have any chance of meeting emissions targets.
Imagine a world in 2050 where the population has risen to and stabilised at around 9 billion, in part due to a rising middle class making up perhaps 50% of the population, with smaller families but higher per capita consumption levels: then the total energy demands might have grown by nearly 5-fold. Those aspiring to an energy intensive life-style will be likely grow proportionally.
If we continue with fossil fuels generating 80% of our energy, we would expect that the global emissions would increase proportionally to say 5 times the current levels. At that rate we would go beyond desired levels well before 2050, setting in train a temperature rise well past the 2oC goal, and placing the planet on a path to unstoppable and calamitous global warming.
We would also have deferred the necessity to prepare for a world without fossil fuels, and through this delay we would have created an even steeper cliff to climb to make the transition to zero carbon.
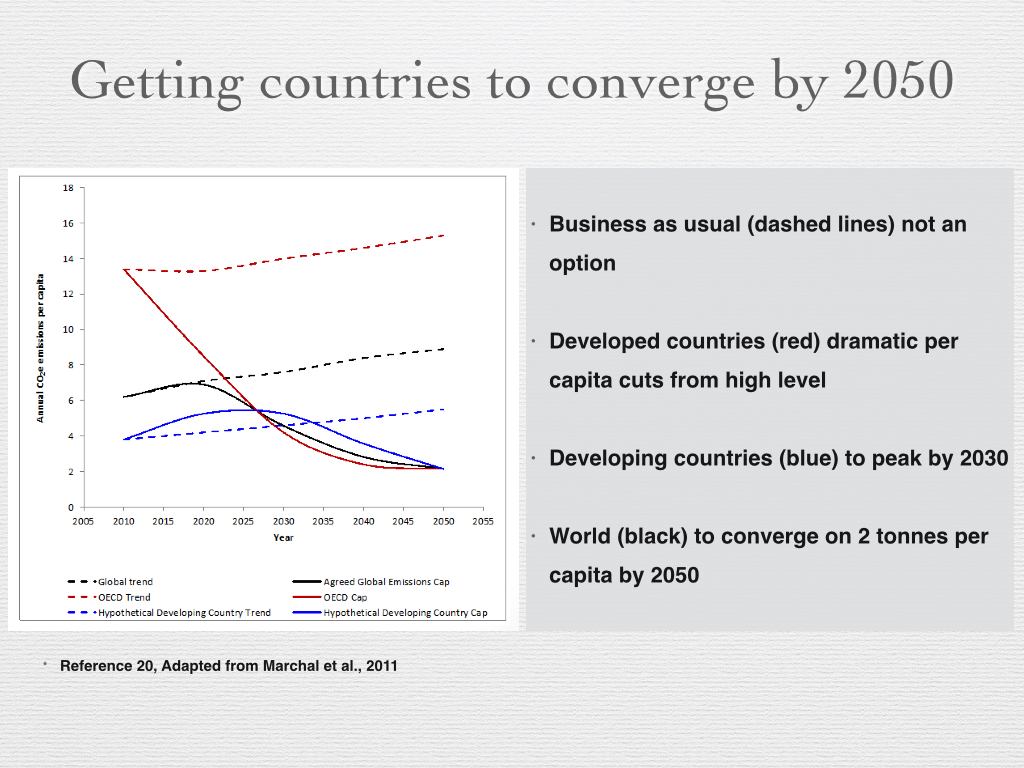
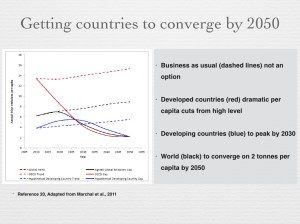
Despite their different starting points, the per capita carbon emissions of all countries need to be planned to move towards zero carbon by 2100, and drastically reduced well before then. Professor Sir David King in his Walker Institute Lecture illustrated a possible scenario to achieve this (Reference 28):
The Paris Climate Summit in December 2015, which was the 21st Conference of the Parties to the UNFCCC (UN Framework Convention on Climate Change) or COP21 for short, has been crucial in providing a framework to achieve this. New to this COP has been an emphasis on ‘bottom up’ initiatives at regional and national levels. The so-called Intended Nationally Determined Contributions (INDCs) have set targets and will enable countries to manage their own plans towards a low carbon future.
Some developed countries like USA and the UK have already been cutting emissions per capita from high levels. Economies like China and India starting at a relatively low level will rise in per capita emissions, peaking by 2030 if possible.
All countries should be aiming to converge on 2 tonnes of CO2 per capita by say 2050, then meet the zero target by 2100.
The above graph from King’s Walker Institute Lecture (Reference 28) plots an outline path towards a zero carbon 2100. The developed and developing parts of the world will follow different routes but need to converge well before 2100 on a greatly reduced level of emissions per capita.
This journey has already started and has been enabled by building new markets. The price per Watt of photovoltaics (PV) has fallen from $76 in 1977 to $0.3 in 2015 (according to Wikipedia). This was helped enormously by the introduction of feed-in tariffs in Europe that helped create a growing market for PV, and competition and innovation combined to help drive down the unit price. This is how markets develop, and it means that the rest of the world can benefit from the seed this created. However, there is a huge mountain to climb to transition the current energy model to a transformed one. It is not about if, but it is about when this must happen.
While Sir David King shows it is possible to stay below 2oC, if we act with urgency, it is becoming increasingly difficult to do so, and some would argue that given the procrastination to date, is no longer realistic. However, that does not negate the need to push for the most aggressive reductions in emissions that are achievable.
7. Is international agreement possible?
There are many examples of where regional and international agreements have successfully regulated environmental pollution, such as acid rain and lead in petrol.
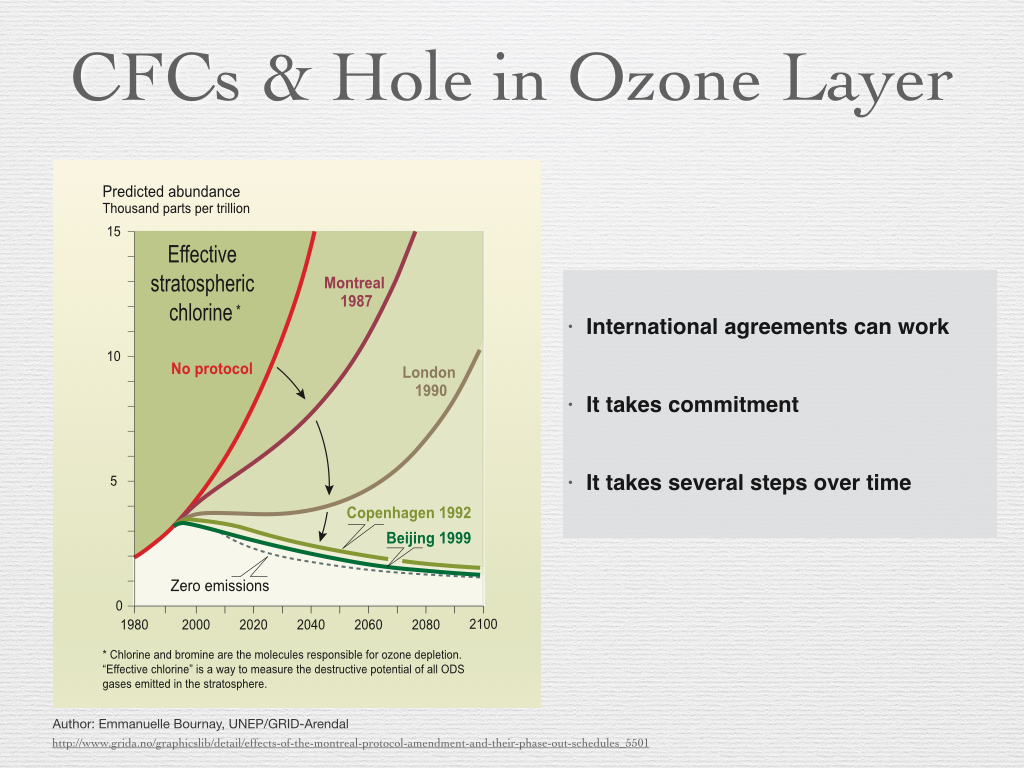
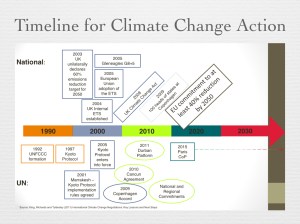
A good example is to recall what was done to address the hole in the Ozone Layer, which was being caused by certain chemicals such as CFCs. This led to the Montreal Protocol (1987), and most importantly the subsequent agreements in London (1990), Copenhagen (1992) and Beijing (1999). The targets for harmful emissions were progressively reduced, including mechanisms to enable the market to transition away from CFCs. The world came together effectively to regulate and progressively reduce the threat.
The following picture demonstrates that agreements on global environmental challenges, like reducing damaging pollutants in the atmosphere, can be effective, but require sustained effort over a number of years.

For global issues like the ozone hole, internationally agreed targets are essential, as Margaret Thatcher observed in her speech to the UN in 1989 (Reference 29). But this leaves industry free to compete. They can make fridges, innovating and competing on a level playing field, albeit one without CFCs.
Global warming is a much more challenging problem to solve. The history of the genesis of the IPCC formed in 1988 is discussed in Weart (Further Reading), and shows how long it took for the foresight of the pioneers in the field to be followed up, and for this to lead to internationally coordinated efforts.
On 1st June 2015, the CEOs of Shell and some other major European based oil & gas companies wrote to the Financial Times (Reference 30), with their letter entitled widespread carbon pricing is vital to tackling climate change, which was also the basis for a submission they made to the Paris Conference (COP21). This is demonstrating that the oil & gas industry is showing some indications of wanting to engage meaningfully, at least in Europe (albeit alongside their contentious desire to promote gas as a bridge to a zero carbon future).
The following Figure (Reference 28), taken from Professor Sir David King’s recent talk illustrates some of the international and national initiatives.
In short, it is not a choice between either environmentalism and regulation on the one hand, or free enterprise on the other, but in fact a combination of all three. There is not only room for innovation and entrepreneurialism in a greener world, but a necessity for it.
8. Planning a path to zero carbon that supports all countries
The path to low carbon will of course require addressing fossil fuels, in electricity generation, transport and industry. However, it is worth noting that improved machine efficiency, reduced travel, better buildings, etc., can make significant contributions (it is not just about changing the source of energy). The concept of ‘stabilization’ of the climate has a been around for some time through multiple parallel initiatives (see for example Reference 31).
Nevertheless, the role of fossil fuels remains a dominant feature of our energy landscape, and the question arises as to how we ensure ‘equity’ in a world where the developing world has neither been responsible for, nor had the benefits of, most of the fossil fuel burned to date.
However, those that claim we would hold back developing countries by denying them the benefits of cheap fossil fuels are ignoring 3 things:
- When carbon pricing, or equivalent mechanisms, properly reflect the damage that is being done, and will be done, then fossils fuels will no longer be cheap.
- The sooner we commit to a future without fossil fuels, the sooner we can develop the new infrastructure and systems needed to enable the transition, including new sources of energy, smart networks, information systems and conservation.
- Some countries are already moving in this direction. Denmark has a goal of producing 100% of its energy from renewables by 2050, and Ethiopia is committing to reduce their CO2 emissions by two thirds by 2050. Despite all the rhetoric, China and the USA are adding large amounts of wind and solar power, and have made recent bilateral commitments. Even in the UK, with huge resistance to renewables in the media at least (which overstates the public’s views), renewables are significant: “Renewable energy provided 13.4 GW, or 43%, of British electricity at 2pm on Saturday 6th June 2015. I believe this is a new record” (Reference 32). This was an exceptional day, but nevertheless it may surprise many people, and is indicative of what could be possible. Also, in the second quarter of 2015, renewables generated more electricity than either nuclear or coal.
So a start has been already been made. Globally we need to increase greatly the level of commitment and delivery, as there is no reason why renewables could not power humanity’s needs:
“Meeting 100 per cent of global energy demands through renewable energy is technically and economically feasible. The main problems are political and social.” Professor Mark Jacobson (Reference 33)
To achieve transformational change one needs a vision and a plan, which will have multiple streams of activity. The Solutions Project have a state-by-state plan to get the USA to zero emissions by 2100 (Reference 34).
For reasons of geography, a similar vision is more challenging for the UK, but a strategy has been developed that could achieve the same for the UK by the Centre for Alternative Technology (CAT) that shows what could be achieved, if we choose that path (see CAT’s Zero Carbon Britain report, Reference 35).
Internationally, we need to have a similar vision and plan to push each stream forward in the overall transformation. In so doing the target needs to include a significant cut in carbon emissions by 2050 in order to keep within the 2oC goal.
The earlier we reach a global peak in annual emissions of CO2, and the lower the peak in total concentration in the atmosphere, the greater the chance of achieving the goal. So every year of delay amounts to additional risk. There is a cost to procrastination, as Michael Mann wisely observed.
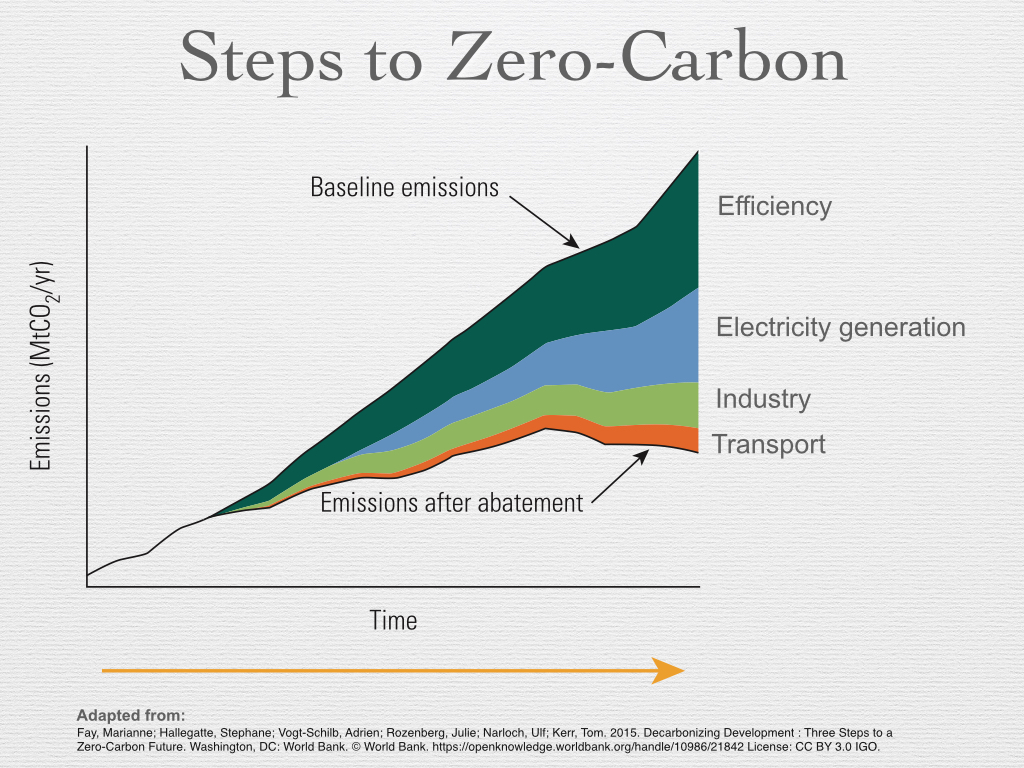
The World Bank has produced a report showing how decarbonization of development can be achieved, with early action on transportation being a key priority (Reference 36).
The following figure is a simplified extract from the referenced World Bank report, giving a flavour of the steps required to get to zero carbon (please read the full report to get a proper appreciation of the strategy).
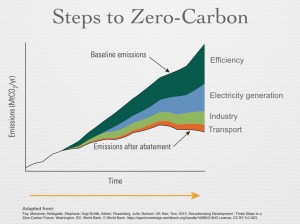
9. The transformation to a zero carbon future
As Elon Musk said, “I think the solution is fairly obvious … we have this handy fusion reactor in the sky” (Reference 37). Man-made fusion reactor technology has no prospect of digging us out of our current carbon hole, which requires action now, not in 50 years time (commercially scalable fusion energy is famously always 50 year’s away), though no doubt in the distant future it could play a role [see Note 15].
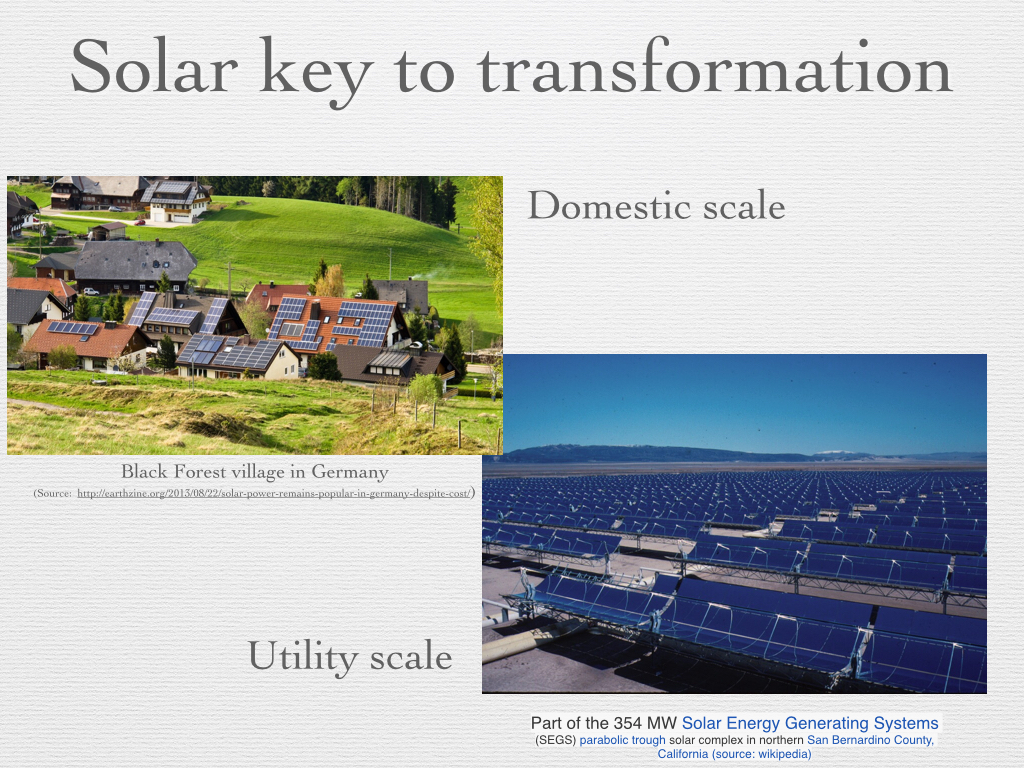
There are many other forms of zero carbon energy to consider – including renewables like wind and wave power – and each country will have its own choices to make based on a wide range of factors. In our windy UK, wind and tidal power have particular potential. However, there are reasons for believing that solar power will play a major role in the future on a global scale.
Today, and every day, the Sun radiates huge amounts of energy onto the Earth:
“The planet’s global intercept of solar radiation amounts to roughly 170,000 TeraWatt [TW] ( 1 TW = 1000 GW). … [man’s] energy flow is about 14 TW, of which fossil fuels constitute approximately 80 percent. Future projects indicate a possible tripling of the total energy demand by 2050, would correspond to an anthropogenic energy flow of around 40 TW. Of course, based on Earth’s solar energy budget such a figure hardly catches the eye …”
Frank Niele (Reference 38).
Humans currently require about 15 TW of power (15,000 GW), and while this would grow as the Earth’s population and standards of living rise (and probably stabilise), it is clear that by harnessing a fraction of the energy provided by the Sun we could accommodate humanity’s energy needs.
If, in 2050, humanity’s power demand peaks at 40TW, then a modest 10,000 solar arrays, each 100 square kilometres (10km x 10km) distributed around the world would deliver at least 100% of our needs [see Note 16].

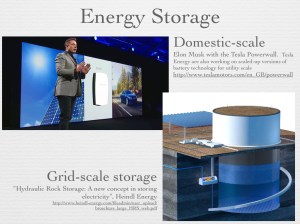
Achieving this solar energy potential in its full sense will require a sustained programme to create a flexible transmission and storage infrastructure, able to handle a distributed renewables network. It would require grid-scale solutions, able to store GW hours of energy. All of this is achievable. The solutions are receiving a lot of focus (Reference 39).
In addition to the domestic and utility scale batteries that Tesla Energy and others are developing, there are other ingenious ideas such as the Hydraulic Rock Storage System invented by Professor Dr. Eduard Heindl (Reference 40). This is analogous to existing reservoirs in places like Scotland, but using a more compact system.
So while we all feel daunted by the transition that needs to be made from our carbon-centric world to a zero-carbon one, it is reassuring to know that some brilliant minds are on the case. They are not waiting for the politicians to all agree.
It is worth recalling that the abolition of the slave trade and then slavery itself met with huge resistance in Britain, embedded as it was in the economy. The point is that sometimes things seem impossible at the start of a change, but appear to be obvious and inevitable with the benefit of hindsight.
The consultancy McKinsey has written of the disruptive impact of solar power on the energy market (Reference 41), in part due to the fact that it satisfies electricity supply when demand is at its peak, thereby undermining the profits of traditional sources of energy that rely of high prices at these times.
There are huge challenges to society to become less wasteful of its material and energy resources, to ensure sustainability for everyone on Earth. However, this is achievable without going back to a pre-industrial past.
It will mean a greater democratisation of resources, and an acceptance that the process of achieving the goals of improved health, nutrition and other measures of well-being cannot be fuelled by fossil fuels. The carbon route is a dead end that will bring more pain than gain.
The impact of global warming on its current trajectory would be disastrous for humanity. And while four fifths of currently known reserves of hydrocarbons are deemed to be un-burnable ‘stranded assets’, if we want a good chance to stay under 2oC (as illustrated earlier), do not expect the carbon industries to be content with current reserves.
They are continuing as we speak to uncover more reserves of carbon in the Arctic, in the Canadian tar sands, through ubiquitous fracking, and so it goes on. Peak oil? Forget it! With advanced seismic techniques the geologists will continue to find reserves. The world has become drunk on carbon!
There is another way. We see the pressure building to ensure those dangerous carbon assets, both present and future, become stranded.
Diverse voices (Reference 42) are raising concerns: the Governor of the Bank of England is urging the financial community to consider the risk of stranded assets; the Pentagon has talked about global warming as a ‘threat multiplier’; and Pope Francis has now added his voice, concerned at the ethical dimensions of global warming.

More radical voices are also coming to the fore including the author Naomi Klein, who sees global warming not so much as an issue of sustainable energy per se, but of justice for those who are and will be most impacted by global warming. While global warming has not been a central issue in recent general elections in the UK, it is rising up the political agenda. It is hardly ever out of the news, and campaigns like the ‘divestment’ movement are getting a lot of people thinking. Many organisations are divesting from fossil fuels.
Those commentators who see reductions in CO2 emissions as a low priority goal in a world crying out for cheap energy to drive developmental goals in emerging economies are falsely framing carbon reduction and economic development as mutually exclusive goals. Far from being just another global problem to add to a long list, global warming has become the defining issue that now frames the others.
“So is the climate threat solved? Well, it should be. The science is solid; the technology is there; the economics look far more favorable than anyone expected. All that stands in the way of saving the planet is a combination of ignorance, prejudice and vested interests. What could go wrong? Oh, wait.” Paul Krugman (Reference 43).
Our response should be positive and aspirational, heralding huge possibilities for innovation and positive changes for a cleaner and sustainable environment. Some countries are already deciding to take this route.
This is a future that remains energy rich, but fuelled by zero carbon sources, with greater energy efficiency and less waste than in our current throw-away culture. In this new world we will address the global challenges of the developing and developed world, because they are linked not separate. No country will be stranded.
We will also be aware of each other’s different backgrounds, cultures and values, which may determine which alternative energy resources we favour or fear. Inclusive public debate is a must.
In reality, the developmental goals that are being pursued in the developing world are crying out for a new model. Zero carbon development, including a major role for solar and other renewables which can be scaled up fast at both small and industrial scales, will help create this new model. Even new Saudi desalination plants are to be powered by solar power. The writing is on the wall for fossil fuels.
Such developments offer hope that a transition to a zero carbon world is not merely feasible within the right timescales, but is actually already underway, and offering a much more credible and sustainable future than a high-risk one based on fossil fuels.

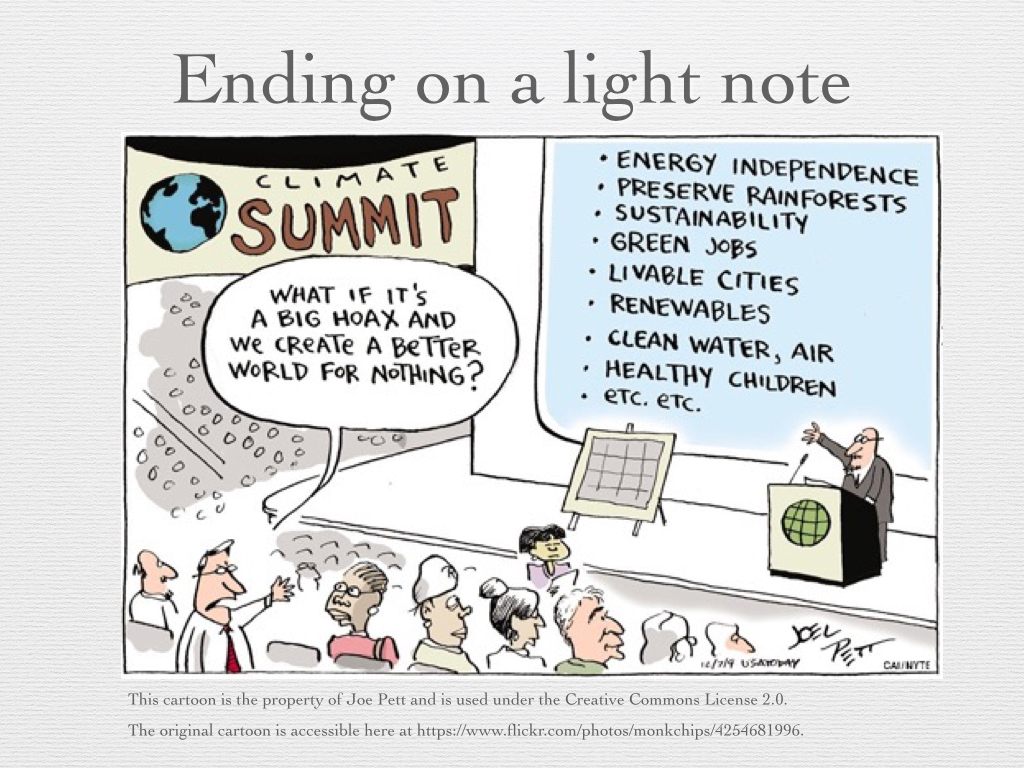
This is a weighty topic, albeit such an important one. In order to end on not just a positive but also a lighter note, I invite you to enjoy the graphic I have included above! My own comment in response is, of course:
We can create a better world, so it won’t be for nothing!
(c) Richard W. Erskine, 2015 (Revised March 2016).
—————————————————————–
****************
References
****************
For completeness references are included, if only to highlight the longevity, depth and diversity of work that has gone into building our current understanding of global warming and its implications. However, for the general reader, I recommend Further Reading, which includes some free to access books and other resources.
- Tyndall, J. (1861), ’On the absorption and radiation of heat by gases and vapours, and on the physical connexion of radiation, absorption, and conduction’, Philosophical Magazine Series 4, Vol. 22: 169-94, 273-85.
- Urey, H. C (1947), ‘The thermodynamic properties of isotopic substances’, J. Chem. Soc.562-581.
- J.R. Petit, J. Jouzel. et. al., ‘Climate and atmospheric history of the past 420,000 years from the Vostok ice core in Antarctica’, Nature 399 (3 June), pp. 429-436, 1999.
- Courtillot, V., “Evolutionary Catastrophe: The Science of Mass Extinction”, Cambridge University Press, 1999.
- Painting, R., ‘Ocean Warming has been Greatly Underestimated’, Skeptical Science, ‘Ocean Warming has been greatly underestimated’14 October 2014
- Fifth Assessment Report (AR5), Intergovernmental Panel on Climate Change (IPCC), is available in full
- ‘Global Climate Change: Vital Signs of the Planet’, NASA
- “2015 was the hottest year on record”, Tom Randall & Blacki Magliozzi, Bloomberg, 20th January 2016
- Animation of the data is provided by the following link [use arrow at base of picture to step through] “What’s Really Warming the World?”
- A graphical and highly accessible summary of the IPCC AR5 in about 200 pages can be found in: “Dire Predictions: Understanding Climate Change: The Visual Guide to the Findings of the IPCC”, by Michael Mann and Lee R. Kump, DK Publishing & Pearson, 2015. [also now available as an eBook]
- A useful summary of the IPCC findings can be found on-line at Serendipity
- ‘”Keeling curve” of carbon dioxide levels becomes chemical landmark’, NOAA, 27 April 27, 2015
- Regarding climate models (state of art, emergent patterns & uncertainties):
- “Climate sensitivity in the Anthropocene”, M. Previdi et al, Quarterly Journal of the Royal Meteorological Society, , Issue 674, July 2013 Part A
- “The Beginner’s Guide to Representative Concentration Pathways”, G.P. Wayne, Sceptical Science, v1.0, August 2013
- “Two degrees: The history of climate change’s ‘speed limit’”, Mat Hope & Rosamund Pearce, 8th December 2014, Carbon Brief
- “Melting glaciers are caused by man-made global warming, study shows”, Steve Connor, The Independent, 14th August 2014
- “Latest numbers show at least 5 metres sea-level rise locked in”, New Scientist, Michael Le Page, 10th June 2015
- “Consequences of twenty-first-century policy for multi-millennial climate and sea-level change”, Peter U. Clark et al, Nature Climate Change (2016)
- “Global warming will cut wheat yields, research shows”, Fiona Harvey, The Guardian, 23 December 2014
- “What is ocean acidification?”, NOAA
- “Climate Change and Heat Waves”, Kaitlin Alexander, 3rd April 2012
- “European summer heatwaves ten times more likely with climate change”, Robert McSweeney, The Carbon Brief, 8 Dec 2014
- Olivier JGJ, Janssens-Maenhout G, Muntean M and Peters JAHW (2014), ‘Trends in global CO2 emissions; 2014 Report’, The Hague: PBL Netherlands Environmental Assessment Agency; Ispra: European Commission, Joint Research Centre
- “How much of the world’s fossil fuel can we burn?”, Duncan Clark, The Guardian, 23 March 2015
- ‘Unburnable Carbon – Are the world’s financial markets carrying a carbon bubble?’, Carbon Tracker Initiative
- “Extreme Carbon Inequality”, Oxfam, December 2015.
- King, D., ’The Paris UN Climate Summit – Hopes and Expectations’, Walker Institute Annual Lecture,10th June 2015
- “Speech to United Nations General Assembly (Global Environment)”, Margaret Thatcher, 8 November 1989.
- “Widespread carbon pricing is vital to tackling climate change”, Financial Times, 1st June 2015, Signed by: Helge Lund, BG Group plc; Bob Dudley, BP plc; Claudio Descalzi, Eni S.p.A.; Ben van Beurden, Royal Dutch Shell plc; Eldar Sætre, Statoil ASA; Patrick Pouyanné, Total S.A.
- Pacala, S and Socolow, R, ‘Stabilization Wedges: Solving the Climate Problem for the Next 50 years with Current Technologies’, Science, Vol. 305, 13th August 2004.
- “New record for UK renewables output”, Carbon Commentary, 7th June 2015
- Professor Mark Jacobson, Director of Atmosphere and Energy, Stanford University and co-author, Powering a Green Planet
- “100% Renewable Energy Vision”, The Solutions Project (this is a state-by-state plan for the USA)
- A UK plan to make the UK to energy use 100% renewables has been developed by CAT: “Zero Carbon Britain: Rethinking the Future”, Centre for Alternative Technology, 2013.
- Fay, Marianne; Hallegatte, Stephane; Vogt-Schilb, Adrien; Rozenberg, Julie; Narloch, Ulf; Kerr, Tom. 2015. Decarbonizing Development : Three Steps to a Zero-Carbon Future. Washington, DC: World Bank. © World Bank
- “The Missing Piece”, 2015 Tesla Powerwall Keynote by Elon Musk, 1st May 2105
- Energy: Engine of Evolution, Frank Niele, Shell Global Solutions, 2005.
- Energy Research in North Rhine-Westphalia: The Key to the Energy Transition
- “Hydraulic Rock Storage: A new concept in storing electricity”, Heindl Energy
- “The disruptive potential of solar power: As costs fall, the importance of solar power to senior executives is rising”, David Frankel, Kenneth Ostrowski, and Dickon Pinner, McKinsey Quarterly, April 2014
- Diverse voices:
- Pentagon Report: U.S. Military Considers Climate Change a ‘Threat Multiplier’ That Could Exacerbate Terrorism, ZOË SCHLANGER, Newsweek, 14th October 2014
- “Bank of England warns of huge financial risk from fossil fuel investments”, Damian Carrington, Guardian, 3rd March 2015
- “Pope Francis and the Environment: Yale Examines Historic Climate Encyclical”, Yale School of Forestry & Environmental Studies, 18th June 2015 (then follow embedded links to the Encyclical or, for the discussion, Watch the event or Read the transcript )
- Bill McKibben, Oil and Honey: The Education of an Unlikely Activist
- Naomi Klein, This Changes Everything: Capitalism vs The Climate
- Divestment Movement
- “Salvation Gets Cheap”, Paul Krugman, New York Times, 17th April 2014
****************
Further Reading
****************
This is by no means an exhaustive list but includes some favourites of mine.
Items 1 and 4 are freely available on-line and offer an accessible combination of the history of global warming science and practical ideas on meeting our energy needs in the future – so good places to start one’s exploration of this broad subject.
For those wanting historical primary sources, Item 2 includes reprints of the paper by Tyndall (1861) and other seminal papers from 1827 to 1987, from a range of key scientific contributors (not all cited in the essay, but no less important for that), covering diverse topics. A history of the research into ice cores is well covered in item 3 in a popular form, by a leading geologist specialising in climate change (and if you visit Youtube, one of the most entertaining speakers you will find on any subject), Professor Richard Alley.
The IPCC report (Reference 6) is an impressive but challenging document. You can probably find time to read the ‘Summary for Policy Makers’, but for a compelling and pictorial guide, Item 5 is highly accessible.
If you would like to explore the science more then Item 6 includes scientific treatments for those with some appetite for more technical explanations of the fundamental science, and won’t be scared off by a few equations: (a) Is a relatively accessible and short book from a leader in the field of the global carbon cycle and its relationship to climate change, Professor David Archer; (b) Is a scientifically literate and well structured blog (rather like a book in web form), that politely deals with blog comments, so useful for those wanting to explore deeper scientific questions, but having difficulty accessing the books; and (c) Is a complete, undergraduate level, textbook for those wanting a structured and coherent synthesis of the science, in all its details, from a leader in planetary climate science, Professor Raymond Pierrehumbert, who was a lead author of the IPCC AR4 Report.
If you want to explore some of the debating points that are often raised about the science, then Item 7 provides a good guide: Skeptical Science does a good job at responding to the many myths that have been spread in relation to the science underpinning our understanding of global warming; Climate Feedback provides annotations of articles which abuse or misuse the science, so you can see comments and corrections in context.
With the exception of Professor David Mackay’s book, I have avoided books or sources covering policy questions (sustainability, energy, economics, etc.), which are crucial to engage on but outside the main thread of this essay.
- The Discovery of Global Warming, Spencer R. Weart, Harvard University Press, 2008 (Revised and Expanded Edition).
- The Warming Papers – The Scientific Foundation for The Climate Change Forecast, David Archer and Raymond Pierrehumbert, Wiley-Blackwell, 2011
- The Two-Mile Time Machine: Ice Cores, Abrupt Climate Change and Our Future, Richard B. Alley, Princeton University Press, 2000
- Sustainable Energy – Without The Hot Air, David JC Mackay, UIT Cambridge Ltd, 2009
- Dire Predictions: Understanding Climate Change: The Visual Guide to the Findings of the IPCC, Michael Mann and Lee R. Kump, DK Publishing & Pearson, 2015.
- More technical, scientific treatments:
- Countering myths
****************
Notes
****************
- If there were no heat-trapping (infra-red absorbing) gases in the atmosphere, the temperature can be calculated using Stefan’s Law and the answer is about -15oC. Actually, this is about the average temperature on the moon that receives about the same amount of visible radiation from the sun as we do on Earth per square metre, and has no atmosphere. So why is the Earth much warmer than this? When visible light from the sun heats the surface of the Earth it warms up, but at the same time it emits energy in the form of longer wavelength infra-red radiation which is absorbed by CO2 but there is infra-red emitted into space. How does this change the temperature of the Earth? This can be thought of as a bucket of water with a hole in it. The visible light is like the water being poured into the bucket, whereas the infrared is like water leaking from the bucket. At some point these balance each other, as the water rises to a point whereby the pressure is sufficient to ensure that the outward flow of water equals the inward flow. The level of the water reached by analogy represents the equilibrium energy retained by the Earth, which translates to a warming of the Earth’s surface. Because of the heat trapping gases, the temperature on Earth is 30oC higher (so about 15oC on average).
- Note that we could have started the narrative with Fourier, who in 1827 had worked out the broad principles of what would be needed to explain the warming of the Earth’s atmosphere. However, I chose to focus the narrative on the ice ages. This is not to diminish Fourier’s contribution and I recommend Weart (Further Reading) to get a fuller account of all the scientists who have made seminal contributions.
- Understanding the atmospheric ‘greenhouse’ effect:
- While there is little doubt that Milankovitch cycles play a key role in the ice ages, the details are subtle. For example, while a change in the eccentricity of the orbit will change the amount of sunlight reaching a pole during its summer, averaged over a year, the change in total energy reaching the Earth is small. The key insight is that the northern hemisphere has more land and overall more ‘seasonality’ so that changes in energy absorbed in the northern hemisphere when the snow/ice cover drops becomes highly significant. There are subtle details to this process involving the Milankovitch cycles, the cryosphere and carbon reservoirs that are still the subject of on-going research. A useful discussion of these subtleties can be found at SkepticalScience, including references to primary research.
- The carbon cycle is complex and works using different mechanisms over different cycle times. Over the period of the ice ages, there was an overall reduction in CO2 in the atmosphere during the colder periods, but this is not as simple as saying that colder sea water absorbed more CO2. This is clarified in a very useful article: “Does temperature control atmospheric carbon dioxide concentrations?”, Bob Anderson, 7th July 2010, Earth Institute Columbia University
- The increase in water vapour concentrations is based on “a well-established physical law (the Clausius-Clapeyron relation) determines that the water-holding capacity of the atmosphere increases by about 7% for every 1°C rise in temperature” (IPCC AR4 FAQ 3.2). For a doubling of CO2 in the atmosphere, the well established radiative physics (definitively laid down in “Radiative Transfer”, S. Chandrasekhar (1950) and a corner stone for climate models), tells us that that would lead to about a 1°C warming. However, the effect of water vapour is to add an additional 2°C of warming (and like with CO2 its the energy budget at the top of atmosphere that is key in determining the warming of the troposphere). This is a fast feedback. This adds up (1+2) to the 3°C of warming overall. This estimate excludes the effects of clouds in the upper troposphere (which tend to lower temperatures by reflecting sunlight) and lower troposphere (which tend to help to trap heat), but which overall appear to cancel each other out, and so have a net neutral impact on the temperature change overall [this is however an area of active research, with a number of questions to be resolved]. There is often confusion about the role of water. For example, a common misconception is that increases in water vapour will lead to more clouds that will then offset the warming, which is false because the relative humidity (which is what largely governs the propensity for cloud formation) stays almost the same (as discussed by Chris Colose in “How not to discuss the Water Vapour feedback”, Climate Change, 2008).
- Another example of the misunderstandings surrounding the role of water vapour is provided by Matt Ridley in an interview he gave to Russ Roberts at EconTalk.org in 2015. There a three factors alluded to here (1) CO2 (2) Water vapour (invisible vapour acting as a GHG) (3) Water in a condensed form in the form of clouds. But in this part of the discussion Ridley succeeds in completely losing sight of factor (2), and while recognising that (3) equates to something small (if not zero), he concludes that the overall warming should be 1°C. Well no! The models used fundamental physics, not “amplifying factors” added as parameters. The effects emerge from this basic physics. Ignoring (2) does not make it go away. It is worrying when someone with as much influence as Matt Ridley (and whose biography of Francis Crick is testament of his qualities as a science writer in another field where he commands respect) seems not to be able to grasp something so basic and well established as this. Here is what he said, which so clearly reveals his misunderstanding of the subject:
- “So, why do they say that their estimate of climate sensitivity, which is the amount of warming from a doubling, is 3 degrees? Not 1 degree? And the answer is because the models have an amplifying factor in there. They are saying that that small amount of warming will trigger a furtherwarming, through the effect mainly of water vapor and clouds. In other words, if you warm up the earth by 1 degree, you will get more water vapor in the atmosphere, and that water vapor is itself a greenhouse gas and will cause you to treble the amount of warming you are getting. Now, that’s the bit that lukewarmers like me challenge. Because we say, ‘Look, the evidence would not seem the same, the increases in water vapor in the right parts of the atmosphere–you have to know which parts of the atmosphere you are looking at–to justify that. And nor are you seeing the changes in cloud cover that justify these positive-feedback assumptions. Some clouds amplify warming; some clouds do the opposite–they would actually dampen warming. And most of the evidence would seem to suggest, to date, that clouds are actually having a dampening effect on warming. So, you know, we are getting a little bit of warming as a result of carbon dioxide. The clouds are making sure that warming isn’t very fast. And they’re certainly not exaggerating or amplifying it. So there’s very, very weak science to support that assumption of a trebling.”
- Why a new equilibrium? Why does the Earth simply not go on warming? One of the reasons is that Stefan’s Law means that the total energy radiated from the Earth is proportional to the temperature (in Kelvin) to the power 4 (so two times the temperature would mean 16 times the radiated energy from the surface). Extending the analogy from Note 1, this is a bit like the following: The increased CO2 is equivalent to a restriction in the ability to emit infra-red into space, or in the case of the bucket, a smaller hole in the bucket. To re-establish the balance (because the flux ‘out’ must balance the flux ‘in’), the level of water in the bucket rises, increasing the pressure of the water at the base of the bucket, and thereby re-establishing the rate of water exiting from the bottom. In the case of the radiative effects of CO2, the equivalent effect is that the height in the atmosphere at which the flux balance occurs is raised and this implies a higher temperature on the ground when one descend down to the surface (using what is called the lapse rate). These effects therefore combine to ensure that at a given concentration of CO2 in the atmosphere, it finds a new equilibrium where the ‘energy in’ equals ‘energy out’, and the surface temperature has increased as the CO2 concentration increases.
- Regarding the ice age ‘lag’ question, the body of this essay provided an explanation. In Serendipity a financial analogy originating from Professor Alley is cited: If I take out a small loan at high interest, and get into a deeper and deeper hole, is it the interest rate or the initial loan that was the problem? Well, it was the interest rate. In the same way, the initial warming of a Milankovitch Cycle may be small, but the CO2 adds a lot of “interest” as does the consequent feedback from increased water vapour.
- From Mackay (see Further Reading), Note 8 to Section 1: “… the observed rise in CO2 concentration is nicely in line with what you’d expect, assuming most of the human emissions of carbon remained in the atmosphere.” A useful way to calculate things is to remember that 127 part per million (ppm) of CO2 in the atmosphere equates to 1000 GtCO2. Now since roughly 2000 GtCO2 are estimated to have been emitted from the start of the industrial revolution to now, and assuming roughly 50% of this figure has stayed in the atmosphere for simplicity (see link below), then 1000 GtCO2 then equates to 127 ppm added to the atmosphere on top of the pre-industrial 280 ppm giving 407 ppm (roughly) in total, so in the right ballpark (we are at 400 ppm in 2015). It is also worth looking up the specific chapter within the IPCC AR5 dealing with “Carbon and other Biogeochemical Cycles”
- The sawtooth reflects the seasonal cycles of the predominantly northern hemisphere deciduous trees and plants. Dead leaves decompose and release CO2, whereas growing leaves draw it down. So the overall trend is overlaid with this seasonal variation. The data is taken from the National Oceanic and Atmospheric Administration (NOAA) who administer the measurements that are presented here
- Here is a simple calculation. Currently we are responsible for nearly 40 billion tonnes (Gt) CO2 per annum. Assuming 50% (Ref. 6) stayed in atmosphere in the short term and given that each GtCO2 equates to 0.127 parts per million (million) to CO2 atmospheric concentrations by volume, we get 0.127 * 50% * 40 = 2.5 ppm. This is about right. In Reference 6, 2001-2011 showed an average of 2 ppm per annum increase, and this rate has been increasing. However, it appears the rate of increase is if anything increasing: in 2015 the NOAA reported a 3 ppm increase of CO2 whilst at the same time the International Energy Agency reported that global emissions have been flat in 2014-2015 period, even while the economy has grown:
- However, it appears the rate of increase in atmospheric CO2 is if anything increasing: in 2015 the NOAA reported a 3 ppm increase of CO2 whilst at the same time the International Energy Agency reported that global emissions have been flat in 2014-2015 period, even while the economy has grown. This suggests that the balance between CO2 being absorbed in the Oceans or other carbon sinks, and the atmosphere, is changing, leaving more in the atmosphere. This is early days and more work is needed to establish is this is a trend.
- We also know that once raised, the newly raised levels in the atmosphere remain raised for thousands of years – see “Carbon Forever”, Mason Inman, Nature Reports Climate Change, 20 November 2008 and this has been further reinforced by a paper showing this in relation to the IPCC AR5 scenarios (see Reference 19).
- The CarbonTracker provides important calculations done by the Potsdam Institute derived from the IPCC AR5 data on ‘carbon budgets’ … “to reduce the chance of exceeding 2°C warming to 20%, the global carbon budget for 2000-2050 is 886 GtCO2. Minus emissions from the first decade of this century, this leaves a budget of 565 GtCO2 for the remaining 40 years to 2050”. The graphics in Reference 19 are eye catching, but in my experience can confuse some people. Hence the inclusion of the figure shown in this document (Fossil Fuel ‘Red Line’) where I try to simplify the key points (you can be the judge as to whether I succeed). The first thing to realise is that the CO2 emissions figures in Ref. 19 are just that (in other words – roughly 50% of these figures remains in the atmosphere [a more accurate figure is 60% but the purpose here is to provide an easy to remember, simple calculation – please refer to Mackay’s book, further reading and Carbon Tracker website for all the details of source data and calculations]).
- During the Paris COP meeting (COP21) in December 2015, 1.5°C was introduced as an aspirational target, while 2°C remains the principal goal. This has been discussed in “Scientists discuss the 1.5C limit to global temperature rise”, CarbonBrief.org, 10th December 2015.
- The Equilibrium Climate Sensitivity (ECS) represents the increase in surface temperatures after a doubling of CO2 (and other GHG) concentrations but also when there is a equilibrium reached between the heat content of the atmosphere and oceans, which has a lag time after the atmospheric concentrations have peaked. The temperature is reached is largely determined by the peak CO2 concentration and the fast feedback arising from increased water vapour in the atmosphere.
- The Earth System Sensitivity (ESS) tries to accommodate longer term changes that could give rise to additional ‘forcings’ such as changes to the ice/snow coverage; release of CO2 and methane from warming of the land and ocean; etc. This involves more imponderables and is over timescales beyond the IPCC timeframe for its scenarios up to the end of 21st century. Long term consequences that are potentially locked in (even if atmospheric warming stabilises) are likely such as increased sea levels beyond 2100 (see Reference 19).
- In rounded numbers, what the Figure shows is approx 2000 GtCO2 emissions from pre-industrial time to around 2011 (rounded figure), and at that point, nearly 3,000 GtCO2 potential emissions if all the listed fossil fuel reserves were burned. The red line is crossed if more than 565 is burned in 40 years from 2011 to ~ 2050. Any fossil fuels in addition to this are deemed “un-burnable” or “stranded assets”. If all the reserves were burned at continuing rate of 40 GtCO2 per year, they would be exhausted by 2075 and we would have crossed the red-line well before 2050. The 40 GtCO2 per year is clearly not a fixed number – the rate of burn will tend to increase if consumption rises in developing countries on back of fossil fuels, but it will tend to decrease as zero-carbon sources of energy replace carbon-based ones.
- In 2013 the world emitted 35.3 GtCO2 equivalent (see Mackay, Further Reading) including man-made greenhouse gases in addition to CO2. In this essay, we have rounded the number to a convenient 36 GtCO2. Sometimes you see emissions in terms of carbon, because reserves of unburned fossil fuels make more sense in terms of carbon, and this often creates confusion. When carbon is burned, it produces CO2. The atomic mass of CO2 is 12 + (2 * 16) = 44, compared to carbon (C) which is 12, so to convert an amount expressed as a mass of carbon to one expressed as CO2 you need to multiply by 44 and divide by 12 (and vice versa). So, 36 GtCO2 equates to 9.8 GtC (12*36/44 = 9.8). In the text we rounded 9.8 to 10, making the 10 GtC figure per annum at 2013 rates.
- If we can make a Deuterium-Deuterium fusion reactor on Earth, rather than the Deuterium-Tritium one that is the current model for tokamak reactors such as ITER, then effectively infinite energy (in human society terms) is available because of the huge reservoirs of energy possible from the Deuterium that could be harvested from the world’s oceans. The issue is that commercial realisation of the dream, even for the easier Deuterium-Tritium reaction is still decades away, maybe 50, and so not relevant to the current debate on options for zero carbon pathways which require heavy cuts in carbon emissions by 2050. We do have a rapidly scalable ‘alternative fusion’ (solar energy).
- Back of envelope calculation on feasibility of solar energy powering humanity:
- At the distance the Earth is from the Sun, it is receiving over 1300 Watts per square metre (W/sq.m) on average during the year, but we can approximate this as 1000 W/sq.m reaching the surface of the Earth on average, allowing for reflected light that does not warm the surface.
- The Earth receives the resulting power from the Sun over an area equivalent to its apparent disc, whereas the Earths surface is 4 times this value (4 pi R^2). Therefore the average power received is (1000/4 =) 250 W/sq.m reaching the Earth’s surface.
- As photovoltaics and other solar energy may be only 20% efficient, we can capture perhaps 50W/sq.m (50 = 20% of 250) which equates to a usable energy of 50 million Watts per square kilometre (W/sq.km) = 50 million W/sq.km
- Now we are assuming that by 2050 the human power requirement grows to 40 TW = 40,000 GW = 40 million million W so we need an area of 40 million million W / 50 million W/sq.km = (4/5) million sq.km which is approx. 1 million sq. km, i.e. a square with sides of just under 1000 km.
- Or more realistically, 10,000 squares distributed around the planet each of 100 sq.km (ie, 10 km sided squares), and each with some energy storage system able to smooth the energy between night and day, connected to a smart grid. Each would produce (40,000 GW / 10,000 =) 4 GW so 100 km.sq solar array equivalent to say four medium 1 GW nuclear reactors or 12 typical 330 MW coal-fired reactors.
- Note: In the text a quote was included from Frank Niele’s book (Reference 30) that mentions a solar intercept of 170,000 TeraWatt (TW = 1000 GW). This is not the practical maximum for solar power we could harness (and Niele is not saying that, but some people might misread it that way). Due to a number of factors (we would only want to use a small area of land for solar, the efficiency of PVs, etc.) the practical limit is very much less. BUT, even allowing for this, the amount of energy is so massive that we are still left with an enormous potential, that far exceeds the 40 TW requirement. We need (in the 2050 projection) ’only’ about 1 million square km (or 0.67% of the Earth’s land area). So, in practical terms, there is no ‘functional limit’ in respect of the energy that humanity needs.
Terminology
Most spheres of enquiry create their own language and jargon, and the science & policy surrounding global warming has its fair share. In the essay I tried as far as possible to avoid using terminology that is not in common usage. As an illustration, I include a few below and my common usage alternative:
- Albedo – is the technical term for the fraction of solar energy reflected into space. More snow and ice means a higher ‘albedo’. In the text I simply refer to the ‘Earth reflecting more light’ to convey this.
- Anthropogenic – often used in context of ‘anthropogenic global warming’. I have used the more prosaic ‘man-made global warming’ instead.
- Climate – this word is unavoidable! It is crucial to understand the difference between Climate and Weather (NCAR provide a short and useful description of the distinction ).
- Because ‘climate’ deals with averaged conditions over extended periods, rather than the precise ‘weather’ at a specific place and time, it is possible to make long-term projections of the climate in a way that is impossible for weather. The climate is then characterised by ‘emergent properties’ of the model ‘runs’, such as averaged values for temperature, precipitation, etc., on a global (and also regional) level over a specified time period (e.g. up to 2100).
- CO2e or CO2 equivalent is used in a few places in the essay. It is used by the IPCC and others as a means of stating a single figure, say, for ‘man-made greenhouse gas emissions’. It aims to include contributions from all greenhouse gases: CO2, Methane, etc. However, it can cause confusion, because of the different ways we can calculate the impact of different gases over different periods. Each gas has different residency times in the atmosphere, and different inherent strengths of their infra-red absorption. This issue has been discussed. The basic point to note is that “CO2 equivalent” aims to include the contributions not only CO2 from burning fossil fuels, but changes in land-use, and all human activities. Also remember that CO2 remains the principal actor and reducing our emissions is what we can control.
- Feedback – is a technical term, which many people will have experienced when rock musicians distort their music by taking a microphone in front of a speaker. The term ‘Feedback’ is now used for any system where the output of the system can ‘feed back’ and influence the subsequent state of the system. There are two types of feedback in general: Positive feedback happens when a signal is reinforced and grows in strength; a Negative feedback happens when a signal is dampened and reduces in strength. “Positive” has therefore nothing to do with “good” or “desirable”, but merely a mathematical adjective. In the essay, we discussed examples of both these types of feedback in relation to climate change [see Section 2].
- Forcing – is a technical term used to denote some effect that adds additional energy to the atmospheric / planetary system, and is measured in Watts per square metre. Extra CO2, solar, aerosols, soot, etc. are all types of ‘forcings’ (which can be positive and negative), but the essay uses colloquial language like ‘influence’ on warming, or ‘contribution’ to energy.
- KiloWatt Hour – The Watt measures the power of an electricity source or the rate of its consumption. It is quite small in the context of domestic devices, so we tend to think in terms of one thousand Watt, which is a KiloWatt. A 1 KiloWatt electric fire is using electricity at the rate of 1 KiloWatt. But this is problematic when trying to articulate our usage of electricity, and it is better to think in terms of the total consumption over a chosen period, like 1 hour. So after one hour that electric fire has consumed 1 KiloWatt Hour. Because we are switching lights on and off, using a toaster for a few minutes, etc. for the domestic total of consumption, we can then think about how many KiloWatt Hours (or KWh in brief) we consume in one day, or one year. We can even express other forms of energy (e.g. the energy used by driving our cars) using the same units. Prof. Mackay (see his book in Further Reading) uses KWh liberally because it is easy to work with in this way. In 2008, the average UK citizen was consuming 125 KWh per day. [Note: One MWh = 1,000 KWh, and One GWh = 1,000 MWh (note shorthands: K=1000, M=1000,000, G=1000,000,000).]
- Parts Per Million (ppm) – is a useful way to state the atmospheric concentration of CO2. The current concentration is 400 ppm. Expressed as a percentage this is (400/1000,000)*100% = 0.04%. There are 6 x 10²³ molecules of a gas in 22.4 litres at standard temperature and pressure, or 30,000 million billion in a cubic centimetre. So at 0.04%, that is still 12 million billion molecules (of CO2) per cubic centimetre, with an average separation between two nearest neighbour CO2 molecules of less than 5 micrometres at this density. Stated like that, CO2 does not seem quite so sparse as the 0.04% figure might suggest.
The End
(c) Richard W. Erskine, 2015, 2016 – EssaysConcerning.com (Published July 2015, Revised March 2016)