Tag Archives: global-warming

Loading the Climate Dice: Why ‘chaos’ does not prevent climate change predictability

Most people have heard about chaos theory, especially as it applies to weather, but may be a little fuzzy about what it all means. They may even hear people claim “if they can’t even predict the weather in a month’s time, how on earth can they tell us what the climate will be in 25 years time?!”.

It’s a fair challenge, but one that has been answered many times by climate scientists [1], but often in ways that perhaps are not as accessible as I feel they could be. When I was recently asked this question I was frustrated I could not share a plain English article with them.

So here is my attempt in plain, non-scientific language to explain how we can project future climate, despite ‘chaos’. I will use the analogy of rolling dice to help explain things – so no equations or mathematical jargon, I promise.

Chaotic Weather

Let’s start with the discovery of ‘chaos’ by Lorenz in 1963 [2]. Weather projections have to start from the current state of the weather and then project forward. The models incrementally step forward to see how the weather patterns evolve over minutes, hours and days. Lorenz discovered that even with the simplest models, if one did two ‘runs’ of the model which had an infinitesimal difference in initial conditions (eg. the temperature in Swindon at 15.0oC and 15.00001oC) the predicted weather can look very different in just a few weeks..

If this was just a trivial observation that errors can magnify themselves in a complex system, one might be tempted to shrug one’s shoulder – and it was not even a new insight [3]. But Lorenz discovered something far more profound: beautiful patterns amongst the chaotic behaviour of complex systems (think of the eddy currents that appear in the turbulent flow of a river). For those interested in learning more about Lorenz’s mathematical legacy, Professor Tim Palmer gave an interesting talk on this [4].

I say ‘errors can magnify’ because sometimes you end up with a chaotic outcome and sometimes you don’t [5]. This is important if you are about to head off to Cornwall for your summer holiday. Weather forecasters now do multiple runs of the models varying the initial parameters [6]. If all the outcomes look similar then the weather system is not behaving chaotically – at least over Cornwall for the period of interest – and the weatherman can say confidently “it will be dry next week over Cornwall”. If, however, out of 100 runs, 20 indicate wet and windy weather, and the rest were dry, they’d say “There is a good chance of dry weather over Cornwall next week, but there is a 20% chance of wet and windy weather”, so take your waterproofs!

Predictable Climate

It really is all about the question being asked, as with most issues in the world. If you ask the wrong question, don’t be surprised if you get a misleading answer.

If I ask the question “will it be sunny in Cornwall on the 3rd of July of 2050?” (wrong question) then it is impossible to say, because of ‘chaos’. If, on the other hand, I ask the question “do we expect the average temperature over Cornwall to be higher in the summer of 2050 as a result of our carbon emissions compared to what it would have been without those emissions?” (longer but valid question) I can answer that question with confidence; it is “Yes”. 

This illustrates that when we talk about weather we are interested, as in our holiday plans or a farmer harvesting their crops, in the specific conditions at a specific place and specific time

Climate is very different, because it is about the averaged conditions over a longer period and typically wider area.

Throwing the dice

I want to illustrate the difference between these two types of question (specific versus averaged) by use of a dice [7] analogy.

If I throw a dice I expect that the chance of getting a 6 to be 1 in 6. If I ask the (specific) question ‘what will the hundredth throw of the dice show?’ (think weather), I am no more certain of the outcome than after 10 throws [8]. 

Now ask a different question: ‘what will be the average number of 6s after 600 throw?’ (think climate). I would expect it to be around about 100. As the number of throws increases I’d expect the average (number of 6s divided by the number of throws)  to get closer and closer to 1 in 6.

This is just how statistics comes to the rescue in the face of the much used, and abused, “chaos” in the climate debate.

You can do this yourself. Make multiple throws of a dice, and after each throw, take the count of the number of 6s thrown and divide by the number of throws – that is the observed odds. You might be surprised to find how long it takes before the odds settles down to close to  1 in 6.

Being lazy, I wrote a little program to plot the result (using a random number generator to do the ‘throwing’ for me). 

The averaged number of 6s converges on the expected odds of 1/6 (shorthand for ‘1 in 6’).

I then imagined two dice, one that was ‘fair’ (where the odds of throwing a 6 were 1 in 6) and a ‘loaded’ dice (where the odds have changed to 1 in 5). This is a analogy for a changed climate where carbon emissions have been happening for some time but have now stopped, and there is a raised but stable concentration of greenhouse gases in the atmosphere. This gives rise to a higher averaged temperature, represented by the higher odds of throwing a 6 in this analogy (see next illustration).

Despite the uncertainty in any specific throw (think weather) in both cases, the average chance of getting a 6 can be predicted (think climate) in both cases. We can see the loaded dice clearly in the graph, compared to the fair dice. In both cases it takes a little time for the influence of randomness (chaos if you like) to fade away as the number of throws increases.

However, the emissions have not stopped, and in fact have been growing since the start of the industrial revolution. There has been a significant acceleration in emissions in the last 75 years. So the amount of accumulated greenhouse gases in the atmosphere has been growing, and with it, the averaged surface temperature on Earth. 

So, taking the analogy one step further,  I created a dice that gets progressively more ‘loaded’ over time (think each year of emissions). 

Now, the averaged chance of throwing a 6 will progressively increase, compared to the fair dice. This is illustrated in the next graphic.

 Again, we see the averaged odds after a number of throws jump around for quite a while (think chaos), but things settle down after a several hundred throws. 

We now see a clear and ever widening gap between the two dice. 

This is analogous to what is happening with our climate: our continuing carbon emissions are progressively loading the ‘climate dice’.

No amount of weather chaos can cancel the climate statistics that become more evident with every year that passes.

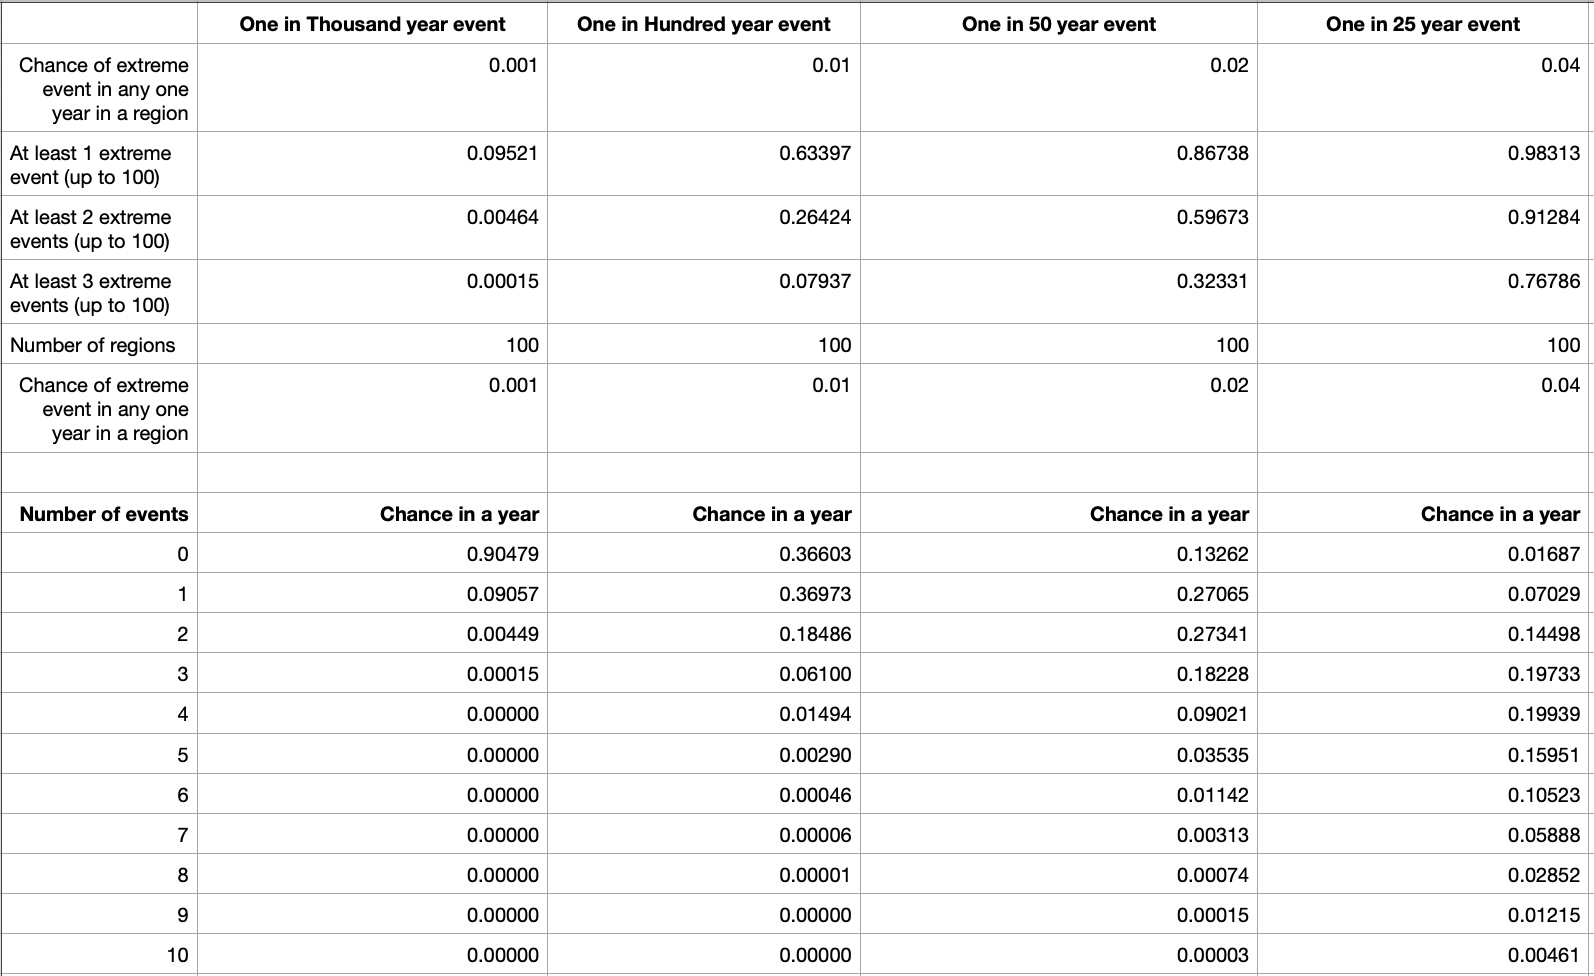
Extreme Weather Events

Now while weather and climate are different, because climate is an average of what the weather is over time, there is an interesting flip-side to this. Since the climate changes due to our carbon emissions, that means the spread of possible weather must have also shifted, to generate a new average.

This means that extreme weather events become much more likely. 

Once again, this is just basic statistics. So events that may have been “one in a hundred years” become much more frequent, and very extreme events, like the 40oC we saw in England in 2022, that were “basically impossible” without our carbon emissions [9], now start to happen.

I don’t want to make this essay longer explaining how this works, and the Royal Statistical Society have done a great job on this, so please visit their explainer [10].

Extreme weather events are now popping up all over the world, almost on a weekly basis, and thanks to the statistics and associated modelling, scientists can now put a number on how much more likely each event has become due to our carbon emissions [11].

We have already loaded the climate dice, the question now is, how much more do we want to load it, and make the odds even worse?

© Richard W. Erskine, September 2025

Notes

  1. Chaos and Climate, James Annan and William Connolley, RealClimate, 4th Nov 2005.https://www.realclimate.org/index.php/archives/2005/11/chaos-and-climate/
  2. Edward Lorenz, Deterministic Nonperiodic Flow, Journal of the Atmospheric Sciences. 20 (2): 130–141, https://journals.ametsoc.org/view/journals/atsc/20/2/1520-0469_1963_020_0130_dnf_2_0_co_2.xml
  3. Stephen Wolfram wrote some historical notes on chaos theory https://www.wolframscience.com/reference/notes/971c/ 
  4. The Butterfly Effect – What Does It Really Signify, Tim Palmer, Oxford Mathematics, 19th May 2017, https://youtu.be/vkQEqXAz44I?si=bLBWR7hLNsHBaE5E
  5. Over the specific place and time period of interest, of course.
  6. This is called ‘ensemble modelling’. 
  7. For the grammar police: common usage now prefers ‘dice’ for singular and plural cases.
  8. In this sense, the dice analogy is somewhat different to climate, because climate change is conditional on what came before, but this does not change the point of the analogy – to distinguish between specific and averaged questions.
  9. UK’s 40oC heatwave ‘basically impossible’ without climate change, Georgina Rannard, 29th July 2022, BBC, https://www.bbc.co.uk/news/science-environment-62335975 
  10. Explainer: Extreme Weather, Royal Statistical Society, https://rss.org.uk/policy-campaigns/policy/climate-change-resources/explainer-extreme-weather 
  11. World Weather Attribution, https://www.worldweatherattribution.org/ 

Leave a comment

Filed under Uncategorized

The elephant (no, scientists) in the room

UK news coverage  just triggered me so please excuse me but really …

Good news: the coverage of heatwaves is drawing the link with climate change on BBC and C4.

Bad news: there seems to be a lot of surprise at this! The dry conditions and repeated heatwaves, causing head scratching on questions like ‘who knew?’, ‘does this herald worsening heat extremes?’, etc. 

Well hello people, this has all been completely obvious to scientists studying climate since at least the 1970s, but society has gone along with denial (yep, we’re all in denial, to some degree).

People talk about the elephant in the room – the thing no one has mentioned but really should not have been ignored. Well, here we have the scientists in the room, including the news room, and now regularly demonstrating the long prediced link between man-made global warming and extreme weather events and episodes..

The Metoffice produces frequent decadel forecasts that few read, and then people get surprised when we have another 100 year heat wave or 100 year flood (following the last one 5 years ago; remember 40C in UK in 2022).

Short memories, and shifting baseline syndrome.

When the odds keep changing the use of the phrase “100 year event” we heard from ‘the orange one’ in relation to the deadly Texas floods, is meaningless, and misleading, but unsurprising from someone who is well into his mission to dismantle the USA’s climate science capacity, weather forecasting, and ability to adapt and respond to extreme weather events (driven by man-made climate change that is the underlying driver).

Switch off if you want to, but the simple truth is that every tonne of carbon dioxide we emit cumulatively turns up the climate one-way ratchet and increases the risk of extreme weather events (at both ends of the hydrological cycle, because warmer air holds more water). 

More emissions. The dice gets loaded a bit more. The odds get changed a bit more. Repeat.

At this rate, by 2100, my great grandchildren will yearn for the (relatively) cool summers of the 2020s. 

And because CO₂ is a long lived greenhouse gas, don’t expect the atmospheric concentration of it to fall anytime soon. Ratchets turn in one direction. Give it hundreds to many thousands of years before long-term carbon cycles begin to reduce atmospheric concentrations to comfortable levels for humanity, but by then on a changed planet.

Prevention is better than cure with a vengeance in this case.

Worried about heatwaves? You should be but please, don’t be surprised.

Worried about the cost of net zero, then don’t be, as the Climate Change Committees 7th Carbon Budget explains:

“We estimate that the net costs of Net Zero will be around 0.2% of UK GDP per year on average in our pathway, with investment upfront leading to net savings during the Seventh Carbon Budget period. Much of this investment is expected to come from the private sector.”

And 0.2% of roughly £3 billion of GDP is just £6 billion a year (and most coming from industry), less than what the UK spends on fizzy drinks. Even the Government’s spending watchdog agrees. And what a fabulous investment with huge ROI (Return On Inhabitability).  The costs of inaction make the costs of action look small by comparison.

Reject the populist, science rejectionists,  who think denial wins votes.

I’ll always vote on behalf of those who come after us who I hope will be wiser, less selfish and less ignorant than our generation have been, yet will feel the full force of our failure to take urgent action when we should have.

Yet, it is not too late for us to reduce harms. The harm-free-option ship has sailed, but every tonne avoided makes a difference, and reduces the level and frequency of extremes to come. 

(c) Richard W. Erskine, 2025 

Leave a comment

Filed under Uncategorized

Stop demanding certainty from climate models: we know enough to act

‘Climate Models Can’t Explain What’s Happening to Earth: Global warming is moving faster than the best models can keep a handle on’ is the headline of an article in The Atlantic by Zoë Schlanger [1]

The content of the article does not justify the clickbait headline, which should instead read

‘Climate Models Haven’t Yet Explained an anomalous Global Mean Surface Temperature in 2023’.

Gavin Schmidt authored an earlier comment piece in Nature [2] with a similarly hyped up title (“can’t” is not the same as “haven’t yet”). He states very clearly in a discussion with Andy Revkin [3], that he fully expects the anomaly to be explained in due course through retrospective modelling using additional data. It’s worth noting that Zeke Hausfather (who also appears on Revkin’s discussion) said in an Carbon Brief article [4] that 2023 “is broadly in line with projections from the latest generation of climate models” and that there is “a risk of conflating shorter-term climate variability with longer-term changes – a pitfall that the climate science community has encountered before”.

It is not surprising there are anomalous changes in a single year. After all, climate change was historically considered by climate science as a discernible change in averaged weather over a 30 year period, precisely to eliminate inter-annual variability! Now, we have been pumping man-made carbon emissions into the atmosphere at such an unprecedented rate we don’t have to wait 30 years to see the signal.

If you look at the historical record of global mean surface temperature, it goes up and down for a lot of reasons. A lot of it has to do with the heat churning through the oceans, sometimes burping some heat out, sometimes swallowing some, but not creating additional heat. So the trend line is clearly rising and the models are excellent in modelling the trend line. The variations are superimposed on a rising trend. Nothing to see here, at this level of discussion.

The climate scientists are also, usually, pretty good at anticipating the ups and down that come from El Nino, La Nina, Volcanic eruptions, etc. (Gavin Schmidt and others do annual ‘forecasts’ of the expected variability based on this knowledge). Which triggered the concern at not seeing 2023 coming, but why expect to get it right 100% of the time?

Don’t confuse this area of investigation with extreme weather attribution, which addresses regional (ie. sub-global) and time limited (less than a year) extreme events. Weather is not climate, but climate influences weather. So it is possible using a combination of historic weather data and climate models to put a number on the probability of an extreme event and compare it with how probable it has been in the past. So, 100 year events can become 10 year events, for example. This is what the World Weather Attribution service provides. The rarer the event, the greater the uncertainties (because of less historic data to work with), but it is clear that in many cases extreme weather events are becoming more frequent in our warming world, which is no surprise at all, based purely on statistical reasoning (The Royal Statistical Society explain here.)

So back to The Atlantic piece.

The issue I feel is that journalists and lay people can’t abide uncertainty. What are the scientists not telling us! In general people want certainty and often they will choose based mostly on their own values and biases rather than expert judgment. In the case of the 2023 anomaly, the choice seems to be between “it’s certainly much worse than the modellers can model”, “it’s certainly catastrophic”, “it’s certainly ok, nothing to see here”, or something else. All without defining “it’s” or providing any margin of error on “certainty”. Whereas scientists have to navigate uncertainty every day.

The fact is that we know a lot but not everything. There is a spectrum between complete certainty and complete ignorance. On this spectrum, we know:

  • a lot ‘that is established beyond any doubt’ (e.g. increasing carbon dioxide emissions will increase global mean surface temperatures);
  • other things that ‘are established outcomes, but currently with uncertainties as to how much and how fast’ (e.g. sea-level rise as a result of global warming and melting of ice sheets, that will continue long after we get to net zero; before it reaches some yet to be determined new equilibrium/ level);
  • and others that ‘currently, have huge uncertainties attached to them’ (e.g. the net amount of carbon in the biosphere that will be released into the atmosphere through a combination of a warming planet, agriculture and other changes – we don’t even know for sure if it’s net positive or negative by 2050 at this stage given the uncertainties in negative and positive contributions).

So we can explain a lot about what’s happening to Earth, we just have to accept that there are areas which have significant uncertainties attached to them currently, and in some cases maybe forever. Not knowing some things is not the same as knowing nothing, and not the same as not being able to refine our approaches either to reduce the levels of uncertainty, or to find ways to address those uncertainties (e.g. through adaptation) to mitigate their impacts. Don’t put it all on climate models to do all the lifting here.

The current climate projections are much more precise than say the projections on stock market prices in 5 or 10 years, but we don’t use the latter as angst ridden debate about the unpredictability of the markets. We consider the risks and take action. On climate, we have enough data to make decisions in many areas (e.g. when it would be prudent to build a new, larger Thames Barrage), by using a hybrid form of decision making within which the climate models are just one input. Even at the prosaic level of our dwellings, we manage risk. I didn’t wait for certainty as to when the old gas boiler would pack up before we installed a super efficient heat pump – no, we did it prudently well beforehand – to avoid the risk of being forced into a bad decision (getting a new gas boiler). We managed the risks.

Climate models have been evolving to include more aspects of the Earth System and how these are coupled together and to enhance the granularity of the modelling (see Resources), but there is no suggestion that there is some missing process that is required to explain the 2023 uptick but probably missing data; not the same thing. Although there is a side commentary in [4] involving input from Professor Tim Palmer calling for ‘exa-scale’ computing, but Gavin Schmidt pushes back on the cost-effectiveness of such a path; there are many questions we must address and can with current models.

There are always uncertainties based on a whole range of factors (both model generated ones, and socio-economic inputs e.g. how fast will we stop burning fossil fuels in our homes and cars; that’s a model input not a model design issue). There is possibly nothing to see here (in 2023 anomaly), but it could be something significant. It certainly doesn’t quite justify the hyperbole of the The Atlantic’s headline.

If we globally are waiting for ‘certainty’ before we are prepared to act with urgency, we are completely misunderstanding how we should be managing the risks of man-made global warming.

We certainly should not, at this stage at least, be regarding what happened in 2023 as an extra spur to action. Don’t blame climate models for not having raised a red flag before or urgently enough – which is the subtext of the angst over 2023.

The climate scientists will investigate and no doubt tell us why 2023 was anomalous – merely statistical variability or something else – in due course. It is not really a topic where the public has even the slightest ability to contribute meaningfully to resolving the question. It might be better if instead The Atlantic was publishing pieces addressing the issue of what questions climate models should be addressing (e.g. constrasting the building of sea walls, managed retreat and other responses to sea level rise), where everyone can and should have a voice (as Erica Thompson discusses in her book [5]).

Climate scientists have been issuing the warning memo for decades, at least since the 1979 Charney Report, with broadly the same message. We read the memo, but then failed to act with anything like the urgency and agency required. Don’t blame them or their models for the lack of action. Ok, so the advance of models has allowed more diverse questions to be addressed (e.g. trends in flooding risks), but the core message remains essentially the same.

And please, don’t use 2023 as another pearl clutching moment for another ‘debate’ about how terrible things are, and how we need more research to enable us to take action; but then turn our heads away again. Until the next headline, of course.

(c) Richard W. Erskine, 2025

REFERENCES

  1. ‘Climate Models Can’t Explain What’s Happening to Earth: Global warming is moving faster than the best models can keep a handle on’, Zoë Schlanger, 6th January 2025, The Atlantic.
  2. ‘Climate models can’t explain 2023’s huge heat anomaly — we could be in uncharted territory’, Gavin Schmidt, 19h March 2024, Nature, https://www.nature.com/articles/d41586-024-00816-z
  3. ‘Factcheck: Why the recent ‘acceleration’ in global warming is what scientists expect’, Zeke Hausfather, 4th April 2024, https://www.carbonbrief.org/factcheck-why-the-recent-acceleration-in-global-warming-is-what-scientists-expect/ 
  4. ANDY REVKIN speaks with longtime NASA climate scientist GAVIN SCHMIDT about his Nature commentary on what missing factors may be behind 2023’s shocking ocean and atmosphere temperature spikes, Youtube, https://www.youtube.com/live/AYknM2qtRp4?si=fsq0y-XkYG58ITw5 
  5. ‘Escape from Model Land: How mathematical models can lead us astray and what we can do about it’, Erica Thompson, 2022, Basic Books.

SOME RESOURCES ON CLIMATE MODEL EVOLUTION

Leave a comment

Filed under Climate Science, Uncategorized

Not In His Time

I love the BBC series ‘In Our Time’ (IOT), conceived by Melvyn Bragg (MB) and hosted by him for over 25 years. The more than 1000 episodes have covered innumerable topics in the arts, history, science, philosophy, politics and much more. Typically three Professors, leading experts in a field, are invited to explore the knowledge and scholarship on the topic of the week. Delightful surprises has been its hallmark covering topics as diverse as ‘Tea’, ‘The Neutron’, ‘The Illiad’ and so much more.

The life and work of scientists have been covered many times: Robert Hooke, Dorothy Hodgkin and Paul Dirac being a few examples. You might think that the most pressing topic of our age – man-made climate change – might get quite a bit of attention, but it doesn’t. It’s not as if its too contemporary for IOT’s tastes; unsuitable for the historical lens that IOT likes to employ. The science of climate change dates back at least 200 years. 

The lives of five scientists come to mind which could help explore the huge subject of climate change: John Tyndall, Svant Arrhenius, Guy Callendar, Wally Broecker and Michael Mann are just a small sample of ones that come to mind. None of these has been covered by IOT. Here’s why each of these would be great candidates for an episode:

  • John Tyndall is regarded as one of the greatest experimentalists of the 19th century, and a great populariser of science. His apparatus – that in the years 1859-1861 demonstrated that carbon dioxide and other gases were heat trapping, but that oxygen and nitrogen were not – can still be seen at The Royal Institution, where he did his experiments. An episode could cover Tyndall or simply be on ‘Greenhouse Gases’ and include a survey of work up to Manabe & Wetheralds seminal 1967 paper.
  • Svante Arrhenius, a Nobel Prize-winning scientist, published the first calculation on how much the world would warm if the concentration of carbon dioxide (CO₂) in the atmosphere doubled – in 1896. Again an episode could cover Arrhenius exclusively or deal with the question of ‘Earth Climate Sensitivity’.
  • Guy Callendar published a paper in 1938 that was the first to demonstrate empirically the correlation between rising levels of CO in the atmosphere (attributable to human activities) and rising global mean surface temperature. Some have even suggested that instead of referring to ‘The Greenhouse Effect’ we should use the term ‘The Callendar Effect’.
  • Wally Broecker was a famous oceanographer who coined the term ‘The Great Ocean Conveyor’, which moves heat around the oceans of the world, and whose understanding is crucial to climate science. He also coined the term ‘Global Warming’. Broecker said that following the publication of Manabe and Wetheralds seminal 1967 paper, man-made climate change stopped being a cocktail conversation amongst scientists, and something that was increasingly concerning.
  • Michael Mann et al published the famous Hockey Stickpaper in 1999 which gathered all the disparate data to demonstrate unequivocally that the world was warming. So powerful in fact that the fossil-fuel funded forces of denial started a vicious campaign to try to discredit Mann. They failed, as the findings have been supported by independent research since.

Needless to say, there are a wealth of women scientists whose work might be considered too recent for IOT, but is often of crucial importance. For example, Friederike Otto’s work on extreme weather attribution has been revolutionary, because now we have the ability to put a number on how much more likely a specific extreme weather event has become as a result of man-made global warming. This can be done in a matter of days rather than the year or more that used to be required for this kind of attribution study (see the World Weather Attribution site for more details). The topic of ‘Extreme weather events’ is assuredly in our time, and increasingly so!

Despite this wealth of knowledge, Climate Change has just once been a topic on the programme, on 6th January 2000 with guests Professor Houghton, who had been a chair of the IPCC, and environmentalist George Monbiot. So no problem, then, it has been covered!

Well, no, because this episode was exceptional in more ways than its rarity.

In every other episode of In Our Time, MB approaches the conversation much like you’d expect of a curious student, trying to learn from the expert professors who he robustly challenges, but respects. The debated points would be ones where experts have engaged in debating a point in the published literature, so disagreements are possible; say, to what extent Rosalind Franklin’s work was key to discovering the structure of DNA. What is not generally entertained on IOT are outlier comments from those who are not experts in the field.

So, the IOT Climate Change episode in 2000 was quite different. Outrageously different. MB approached the conversation not as a curious student, but sounding more like an opinionated journalist with an angle doing an interview, and boy, did he have an angle! 

He had a completely different tone to normal, not of respectful enquiry. He reprised talking points that are rife within climate science denial circles, and even cited Matt Ridley (“no slouch”) a well known propagandist – a free-market fundamentalist like his father – who engages in constant attacks on climate science, and the climate solutions he wishes to undermine.

Leo Hickman noted on Twitter (3-1-2015) “Little known fact: Bragg witnessed GWPF’s Companies House docs for Lord Lawson”, so one is bound to speculate whether it was no accident that MB was channeling the GWPF (Global Warming Policy Foundation) non-science.

It’s easier to see what I mean about the episode by listening to the episode but I will use some snippets from the transcript here to illustrate what I mean (MB quotes in italics):

  • “With me to discuss what could be called “The new climate of fear” at the beginning of a new century is …”, from the off, it was clear that MB was not interested in obvious questions like “how have we come to an understanding of man-made global warming?”. He clearly wanted to frame it in a way that minimised any discussion of the underlying science. He wanted it to be a ‘both sides’ apparent exchange of newspaper comment pages opinion.
  • After George Monbiot’s first contributions, MB chips in “Now this is very much a received view, and you’ve been one of the people that have made it received by banging on, very effectively in the Guardian and in other places, I’m going to challenge this in a minute or two, but I just want to emphasise to the listeners, how apocalyptic your views are, …” – trying to undermine his guest with a charge of alarmism shocked me 24 years ago and shocks me still. The reason it is ‘received’ Melvyn is because of decades of research, thousands of scientific papers, and resulting IPCC (Intergovernmental Panel on Climate Change) reports, not Monbiot’s writings, however lucid they may be.
  • MB later pushes harder “Right now, you two have spent….devoted your lives to this subject and I haven’t, but nevertheless, I’ve looked at…tried to find some evidence which contradicts this block view, which seems you’ve got your evidence, but there’s other points of view , and ….’cause I’m worried about the evidence that you can know so much about what’s going to happen in 100 years time, and I’m worried about the lack of robustness …”, but never asks the question ‘please help me understand the evidence’, no he shares what he has read who knows where – in The Spectator perhaps. This might seem normal on a social media comments thread but is pretty unedifying on the normally rather good In Our Time.
  • MB says something that is straight from the climate science denial factory at GWPF: “Mmmm, but you…well er…I’m still worried about the evidence for this, the evidence that you….what evidence can you tell us Professor Houghton, that in the next century….’cause all this is to do with man-made pollution isn’t it? That the worry is that this is the Greenhouse Effect, it’s all to do with us emitting too much CO₂, and that sort of thing, can you give us your evidence, for the…why the accumulation of this is going to have such a devastating effect? Because people use extra CO₂ as fertiliser don’t they? To bring crops on?”

The framing, the tone, the references to denialist talking points (such as: ‘carbon dioxide being good for plants therefore must be good to have more of it’, would fail Philosophy 101, let alone the scientific demolition of it).

All of the talking points he raised have been answered innumerable times, if he bothered to do genuine background reading from experts on the subject.

There have been other episodes of IOT that have touched on climate since then, such as the ones on ‘Corals’, ‘Ice Ages’ and others, but clearly both Melvyn Bragg and the production team are staying well clear of man-made climate change after their last diabolical attempt.

What motivates MB’s climate denialism is unclear. It is certainly not independent scholarship. The history of our understanding of climate change has been set out clearly many times, such as in Weart’s book (see Notes). Yet, being a Labour Peer, the free market fundamentalism that drove Lord Lawson and continues to drive much of the funding for climate denial, is unlikely to be the reason. Maybe in some perverse way, it’s his faith that took him there – who knows? The fact is he was very poorly read and badly briefed. It has left a large black hole in an otherwise great series, In Our Time, that is surely crying out to be filled.

No doubt an episode entitled ‘Man-Made Climate Change’, or one based on the life and work of the many scientists that have done so much to reveal our understanding of it, will come back as a topic in due course. There are no shortage of topics linked to it that could also be covered (Fossil fuels, Energy transitions, Extreme weather events, Rossby waves, and many others).

Though I suspect it will not be in Melvyn Bragg’s time.

We’ll have to wait for the sad day when the great man moves on.

(c) Richard Erskine, 2024.

———————— o O o ———————–

Notes

I have not made the essay longer still by including the rebuttals to all the talking points raised by MB, but I don’t need to as others have done a great job addressing commonly shared myths. A good place to go for short non-technical responses is Katharine Hayhoe’s ‘Global Weirding’ series of short videos.

For a slightly longer response to the many myths raised, the site Skeptical Science provides answers in shorter form and longer form. And, specifically, on the argument that more carbon dioxide is good for plants, there is a great rebuttal on the site.

The book by Spencer Weart I mentioned is a great historical survey – starting with scientists like Fourier in the early 19th Century – and is available online: The Discovery of Global Warming.

Of course, the most up to date and rigorous evidence on the causes and impacts of climate change, and on the possible scenarios we may face in the future, is contained in the IPCC (Intergovernmental Panel on Climate Change) reports. The latest full assessment being the 6th Assessment Report.

Getting a reliable sense of what the science is telling us can be hard for non-experts, particularly on shouty social media. I always feel we should go back to the established experts. Some summaries can be useful if they do not try to selectively spin the science in a direction to support a particular framing.

  1. CarbonBrief do a great job summarising the science such as here: In-depth Q&A: The IPCC’s sixth assessment report on climate science, Carbon Brief, 9th August 2021 https://www.carbonbrief.org/in-depth-qa-the-ipccs-sixth-assessment-report-on-climate-science/
  1. Intergovernmental Panel on Climate Change (IPCC) is an international body whose work is the product of an international team of scientists from over 60 countries who give their time voluntarily to produce in depth reports. The Sixth Assessment Report (AR6) is the latest full assessment, and covers different aspects: causes, impacts, adaptation and mitigation, both globally but also from a regional perspective. One of the reasons people go to secondary sources is because of the huge size of the IPCC reports. But the IPCC provides summaries. The AR6 report comes in three parts, with summaries as follows:
  1. Part I: Physical Science Basis Report assesses the causes, and possible future scenarios.An accessible summary is available as a short video: https://youtu.be/e7xW1MfXjLA A written Summary for Policymakers is available here https://www.ipcc.ch/report/ar6/wg1/downloads/report/IPCC_AR6_WGI_SPM.pdf
  2. Part II: Impacts, Adaptation & Vulnerability Report assesses ecosystems, biodiversity, and human communities at global and regional levels. It also reviews vulnerabilities and the capacities and limits of the natural world and human societies to adapt to climate change.An accessible summary is available as a short video: https://youtu.be/SDRxfuEvqGg A written Summary for Policymakers is available here https://www.ipcc.ch/report/ar6/wg2/downloads/report/IPCC_AR6_WGII_SummaryForPolicymakers.pdf
  3. Part III: Mitigation of Climate Change Report assesses ways to reduce carbon emissions.An accessible summary is available as a short video: https://youtu.be/7yHcXQoR1zA A written Summary for Policymakers is available here https://www.ipcc.ch/report/ar6/wg3/downloads/report/IPCC_AR6_WGIII_SPM.pdf

If IOT do decide to do a new episode on Climate Change – or more accurately, man-made climate change – they might do well to first re-read Professor Steve Jones’s 2011 report on coverage of climate change at the BBC, and its tendency of using false balance. The report recommended that the BBC coverage “takes into account the non‐contentious nature of some material and the need to avoid giving undue attention to marginal opinion” (download the document then skip to page 14 to get to the report, avoiding the self-justification by BBC senior management prefixing the report itself.)

We can live in hope!

Someone asked about the Ice Ages episode (which I did mention). 

This was my response.

Yes, but it only dealt with man-made climate change in the dying few minutes. Richard Corfield, when not talking over the two women scientists with him, was dismissive of the risks. He used an argument that fails Critical Thinking 101, along with Ethics 101, and more.

His gobsmacking words: 

“a ‘Greenhouse Climate’ is the natural condition for the Earth. 85% of Earth history has been ‘Greenhouse’ Ummm, 70 million years ago carbon dioxide levels were 8 times what they are at the moment, which made them 2,400 parts per million. Before that they were 12 times higher. The only certainty is that climate change is a natural part of the Earth and as a species we may have been the result of climate change. We may now be altering it but anyhow we’d have to deal with it, so I think we are going to have to geo-engineer our own climate to deal with it. Nothing wrong with that.” 

A logically incoherent argument. And it’s not ‘we may now be altering’, we are altering, please read the IPCC reports Richard.

To conflate tens of millions of years with Homo Sapien’s quarter of a million years of existence; or the 12,000 years where civilisation has emerged, in the stable climate we have enjoyed alongside nature since the end of the last ice age; or indeed the 200 years where man-made carbon emissions have increased CO2 levels at an unprecedently fast rate in geological terms, is crass

The way to stop additional warming is simply to stop burning fossil fuels as soon as possible

To simply shrug and say that the climate always changes so we’d have to have done something anyway at some point is asinine, and fails to mention that we’d have had 10s of thousands of years to deal with it, not the few decades we now have left to do something, precisely because of naysayers like Melvyn Bragg and Richard Corfield. 

No wonder this disaster climate advocate Richard Corfield has been on IOT 8 times.

———————— o O o ———————–

Leave a comment

Filed under Uncategorized

Expect the Unexpected

As I discussed in a previous essay Is 2°C a big deal?, we know that as the world warms the chance of extreme weather events will increase markedly. This essay does not revisit that established insight, but is more of a diversion, exploring simple probabilities.

Attribution studies can now routinely provide estimates of how much more probable a particular event has been made as a result of man-made global warming. The World Weather Attribution organisation provides many example.

There will be impacts on the environment, society and agriculture. Focusing on the latter, sceptics might say, “ok, the chances are increasing, but if we have a crop failure in one region, one year, we have many regions able to compensate.” 

The follow up question that comes to my mind is “if I accept that point the question is then how often will we have multiple failures in a given year?”.

There can be some big surprises when one explores probabilities. Bear with me as a tease out a few insights.

A famous example of surprising odds

Imagine there is a public meeting and people arrive one to one. Assume they have random birthdays and we exclude siblings. The question is: how many people need to arrive before the chance of two of the people present having a greater than evens chance of having the same birthday?

What number do you expect? Think about it.

To answer this it’s easier to start by determining the chance for each arrival to NOT have the same birthday. The 1st arrival has 365 choices out of 365. The 2nd arrival has 364 choices out of 365 to avoid having the same birthday. The 3rd arrival has 363 choices out of 365 to avoid a clash. And so on.

So the probability for 3 arrivals not having the same birthday is (365/365) x (364/365) x (363/365) which equals 0.9918 (rounded). So the chance that at least two of these three having the same birthday must be 1 minus this, which equals 0.0092 – see Note [1]. This is pretty small; about a 1% chance.

If you keep repeating this process, surprisingly one finds we only need 23 people to arrive for the chance of two matching birthdays to be greater than even (ie. greater than 0.5). See table in Note [2].

As you can see from the table, for 10 arrivals the chance of a match is just under 1 in 10 (0.1), but then rapidly escalates.

Calculating the chance of extreme weather events without global warming

By extreme weather events I’m not talking even about the current serious flooding in the UK. I’m talking about an event that would take out the arable sector in a large area. 

To make this simple and purely as an illustration, I will take the 1,400 million hectares of arable land globally and break this down into 100 blocks, each of 14 million hectares.

Since the UK has 13 million hectares of arable land, the world figure can be thought of as about 100 UKs (of arable land only).

If the chance of an extreme weather event anywhere across the world between 1900 and 1950 was on average 1 in 1000 per year, that in effect defines what level of event we mean by ‘extreme’ for this illustration.

Then, we need to ask the question: what would have been the chance of 2 extreme events occurring in any one year? What about 3?

Let’s first follow a similar but adapted method as with the birthdays. 

The chance of NOT having an extreme weather event in the first block is 1 minus (1/1000), which equals 0.999. 

Now, the probabilities for each block are assumed to be independent, so the chance of NOT having an extreme weather event in any one year in all blocks is 0.999 x 0.999 x …  x 0.999 (with 100 factors), and this equals 0.90479. So a 90% chance of not having an extreme weather event in any of the 100 blocks.

So the chance of having at least one extreme event in any one year across the 100 blocks would be one minus this figure, so that = 1 – 0.90479 = 0.09521 = 0.1 approx, or 1 in 10, or 10%. This is not insignificant. It means that a 1 in 1000 year event will happen once every 10 years somewhere on the planet.

In the next section I’ll use the percentage form, rounded to 2 significant figures to express the odds.

We have gone from a 1 in 1000 chance of an extreme event in one block in one year, to a 1 in 10 chance of at least one extreme weather event across the 100. A simpler way to see this is the 100 x (1/1000) = 1/10.

Moving to multiple extreme event is not so simple.

The basic idea is to visualise the 100 blocks as containers, and the chance of an extreme event as a ball that can be put into a container to indicate an extreme weather event has happened there. 

Then, calculating the odds becomes an exercise in counting all possible permutations.

If there were 2 events in one year, then they could be in the same block (and there are 100 ways for that to happen), or in different blocks (and the chances of that are a little more complex to calculate). In general, we need to work out the odds of how you sort X objects amongst 100 containers. We do that using something called a ‘binomial expansion’ – see Note [3] if you want to dive into the details.

We can then look at what happens when the chance of any single event changes due to global warming changes from odds on 1 in a 1000 to say 1 in a 100.

The chance of extreme weather events with global warming

To explore the impact of global warming on the change odds, I have used a progression as follows. The average chance of an extreme weather event in any one year, in any one block, was 1 in 1000 but as the world warms it might become a 1 in 100 year event, or worse a 1 in 50 year event, or worse still a 1 in 25 year event. In Note [4] there are details on calculating the odds for up to 10 events per year across the 100 blocks.

The odds for a single event are already changing. The 40C weather we had in the UK would have been virtually  impossible without man-made global warming. But the purpose of this essay is not to make projections or estimates, but simply to illustrate the surprising change in odds that occurs when multiple events are involved.

Here is a summary of how the odds change in our illustrative example:

We see that in the warmest scenario (1 in 25), an extreme weather event is likely to happen every year somewhere in the world (98%), but there is a high probability (77%) of there being 3 events occurring in a single year across the world.

If we have 2 or 3 blocks in the world suffering from extreme weather events and consequent crop failures, then that starts to have a major impact on food supply, which is potentially catastrophic.

What is worrying is how the odds of multiple events can escalate quite fast.

So if you have the feeling that more than one extreme event seem to be occurring every year around the world – more frequently than they were a few decades ago – you are not wrong.

(c) Richard Erskine, 2024

————————————— o o O o o ——————————————

NOTES

These notes are only included for those that wish to check my workings. Thanks in advance for spotting any errors. If you are not interested in the details, you don’t need to read these notes.

[1] The one minus trick

If you pick a card from a normal deck of cars, the chance of pulling an ace of spades is 1 in 52. As a number that equals 0.01923, it’s probability. But there is 100% chance (a probability of 1) of pulling a card, so one can say the chance of NOT pulling the ace of spades is 1 – 0.01923 = 0.98077 (which is also what you get from the fraction 51/52).

If a probability of an outcome is difficult to calculate it can sometimes be easier to calculate the probability of not having the outcome, and then using the ‘one minus …’ trick.

So we want the chance of at least one extreme event across 100 blocks. We could try to calculate the chance for 1 event, the chance for 2, then 3, all the way up to 100. The trick is instead to calculate the probability of there being no event across all 100 blocks. Then by taking the resulting probability from one, we get the probability of at least one event occurring. 

[2] A famous example of surprising odds 

Table calculating the odds: 

The Product is the calculated by multiplying the successive A/B values. So for 4 arrivals the Product = 1 x 0.9973 x 0.9945 x 0.9918 = 0.9836 is the probability that none have the same birthday. So the chance of at least two having the same birthday for 4 arrivals = 1 – 0.9836 = 0.0164

[3] Use of the binomial expansion

Let’s assume that the probability of a loss of crops due to an extreme weather event in any one year for any region (because of many possible direct or indirect effects: extended heat wave; flooding; inability to work outside; migration; war) is p, then:

The chance of there NOT being an extreme event in one specific region in any one year is (1-p)

The chance of there NOT being an extreme event ANYWHERE in the world (for all n blocks) in any one year is (1-p) raised to the power n, which is written (1-p)n

Therefore, the chance of there being at least one extreme event (ie. 1, or 2, or 3, etc.) anywhere in the world, in any one year is 1-(1-p)n

The probability of exactly k out of n regions being hit by an extreme weather event in any one year is trickier to calculate but can be done using the binomial expansion:

P(k,n) = ( n!/ (k!(n-k)! ) * pk * (1-p)n-k

To create a table it is convenient to use a generator (especially if n gets very large, as some spreadsheets will blow up or truncate numbers in an unhelpful way), so, we start with P(1,n):

P(1,n) = n * p * (1-p)n-1

P(2,n) = ((n * (n-1)) / 2) * p2 * (1-p)n-2

and in general there is the way to calculate the next number based on the previous one:

P(m+1,n) = P(m,n) * ((n-m)/(m+1)) * p / (1-p)

This is the formula used in the Table (see Note [4]) for P(2,100), P(3,100), etc.

eg.

P (2,n) = P(1,n) * ((n-1)/(2) * p / (1-p)

The sum of P(i,n) from i = 0 to n must be 1

For n=100, the chance of at least 1 event would be P(1,100) + P(2,100) + … + P(100,100).

The chance of at least 2 events would be P(2,100) + P(3,100) + … + P(100,100).

And so on.

[4] Table of probabilities based on binomial expansion

END

Leave a comment

Filed under Uncategorized