The irony of JD Vance suggesting Britain is in the grip of cultural decline then holidaying in the Cotswolds was not lost on the natives who protested his presence, or the staff who refused to serve him at an up-market pub. Given the state of the USA at present, with its rapidly receding soft power, one might suggest he looks closer to home for cultural collapse.
It seems that, much to the surprise of the ill-educated VP, the Cotswolds is not an England of Mary Poppins and country cottages, frozen in aspic. In fact, the Brits have never been like that, except for gullible tourists. Behind a facade of tranquility, we’ve always been a pretty feisty lot when we need to be.
We also have a history of absorbing diversity. Just study the archaeology of the London, that Rome founded, or the tens of thousands of Huguenots who fled to Britain. They were not just sheltered here, but played a significant role in our commercial and cultural development. The diversity we find in London’s cuisine today is just another indicator. Trump’s relentless attacks on London’s Mayor rails at this diversity success story with barely concealed racism.
There is now a racially motivated right wing MAGA movement in the USA. This is an old story, and it never ends well.
It is no different in essence to every other racially motivated project that sought ill-conceived racial ‘purity’ over diversity. The list is a long one, and in no particular order: genocide in the Balkans; Apartheid in South Africa; Hindutva in India; the Holocaust/Shoah in Nazi Germany; and the ethnic cleansing perpetuated across the empires of Britain and other European powers.
Interestingly, exploitation of indigenous land and peoples, with its attendant extractivism and racism, has often been linked to climate change and continues to be so [1].
Eugenics was so popular in Britain that both the left and right promoted it. Francis Galton was not alone. As Adam Rutherford documents in his book Control: The Dark History and Troubling Present of Eugenics, many of our best known cultural figures were supporters. It was establishment thinking for the likes of H G Wells, Winston Churchill, George Bernard Shaw, Marie Stopes, and more.
They based their erroneous beliefs in part on a simplistic hereditarian mindset, which is perpetuated in how we’ve been taught eye colour genetics in school [2]. Some Eugenicists proposed genocide while others proposed ‘humane’ sterilisation. We are ignorant of this history because we choose not to face it.
The need for identity is a strong pull factor in all of us, so erroneous genetic beliefs persist in apparently benign forms, turbocharged by those DNA services that might tell you that you are 10% nordic. “Phew, I made it”, I hear some poor MAGA convert announce.
All nonsense, but almost everyone plays the game “your paintings are really good but then there have always been great artists in the family”, I am told. Nope! I had an interest in art and worked very hard to develop my practice; no freebies [3].
The desire for identity can so easily turn toxic, and it seems the US Administration under Donald Trump now equates diversity with cultural collapse.
David McWilliams shows in his book Money: A Story of Humanity, that diversity is always the route to greater prosperity. He gives many examples but the rich diversity of Norman Sicily is perhaps the most impressive of all.
We can learn much from nature in this regard, because nature abhors monocultures. It withers amongst the neatly trimmed lawns and acres of hard standing in America’s suburbia, where nature is curated almost to extinction.
Nature flourishes in messy diversity, as in a coral reef. Human societies and cultures do too.
So, let’s end our simplistic hereditarian mindset for good, and embrace the diversity that always has, and always will, enrich our lives culturally, commercially and in our communities.
The European colonisation of the Americas killed so many by 1600 (about 56 million indigenous people) that forests grew back where their crops once grew (lowering the carbon dioxide concentration in the atmosphere) that then cooled the Earth. Our contemporary extraction and subsequent burning of 300 million year old fossil fuels is not only warming the planet by putting ancient carbon into the atmosphere, but severely polluting indigenous lands: the water resources in North America polluted due to tar sands mining; the decades long impact of Shell’s oil extraction on the Niger delta; the environmental catastrophe created by the monumental Deepwater Horizon oil discharge; this list goes on. Amitav Ghosh’s The Nutmeg’s Curse: Parables for a Planet in Crisis gives a visceral historical account of the connections between empire, racism, extractivism and climate change.
Gene expression is more complex than the simple Mendelian theory of dominant and recessive genes. For eye colour there’s a gene for colour, but also, a gene that controls the extent of expression of the colour gene. So in practice we get a spectrum of eye colour that includes hazel, for example. While brown is dominant (i.e. the simple rule is that it trumps blue in a partner), in fact two brown eyed parents can sometimes have a blue-eyed child.
I’m a decent painter mainly because of hard work. I’ve always loved art and science, but at school I was forced to choose, and I chose science. My wife and I visited many exhibitions over the years, but always as onlookers. Only in retirement did I find the time to really focus on developing my art. It’s taken 10 years since then to really master it. I reaped the rewards of hard work and great mentors, not some easy “it’s in your genes” freebie. Even accepting that ‘nature’ and ‘nurture’ each play a role, we put far too much weight on ‘nature’ in many cases.
If people are confused about what to do about climate change in their everyday lives, they have every right to be.
Fossil fuel companies have for decades funded disinformation through a network of ‘think tanks’, and commentators, planting stories in the media. This was all helped by PR and Advertising agencies who know how to play with people’s emotions; to create fear, uncertainty and doubt.
Many have explored this issue more deeply than I ever can or will. Notably, Oreskes and Conway showed, in their book Merchants Of Doubt [1], how the same tactics used to promote smoking and deny its harms, were used by tobacco companies.
We might imagine we can now see through their tactics. I’m not so sure. I feel there is a tendency amongst some progressives to almost fall into the trap of amplifying the messages.
I am thinking of how some who claim that heat pumps are for the comfortably well off and it’s not fair to push them for those in energy poverty. The alternative – to stick with the comfort zone of insulating homes – came to be the default. This is not fair to anyone.
Before we get on to that, let’s start with the birth of ‘climate shaming’.
Climate Shaming 1.0: It’s your demand that’s the problem!
It is well established that fossil fuel companies like Exxon and their network decided to make you, the consumer, the problem [2].
The message:
It’s you driving your car and running your gas boiler. We are just meeting your demand, so don’t blame us.
Intended result:
Guilt, denial and inaction.
It is even alleged that BP and their communication agency Ogilvy cooked up the idea of ‘carbon footprint’ [3]. We could all then measure our level of guilt. No wonder people often resorted to tiny actions to salve that guilt, when they felt powerless to do more.
Yet, there is a counter argument that while this was and remains a key plank in the strategy to delay action, measuring things can be useful. What is needed is to shake off the guilt and find ways to act.
Climate Shaming 2.0: It’s all your fault!
Shaming has metastasised into everything we do that we can feel guilty about, where fossil fuels are often out of sight.
There are many voices at work here, but in the background, fossil fuel interests are keen to keep the heat on you, dear citizen, rather than them.
They will claim to be doing their bit, with greenwashing PR and advertising … now over to you people!
While they don’t control every part of this conversation we have amongst themselves, they have the wherewithal to influence it in a myriad of ways. The message we receive is, “don’t do this bad thing” (but we, fossil fuel interests, won’t help you):
Don’t fly to Europe (but we won’t divert fossil fuel investments into trains)
Don’t eat meat (but we’re happy to reinforce your guilt, when the Amazon burns; for cattle feed)
Don’t eat Ultra Processed Foods (but like this behemoth, we work hard to ensure law makers give our fossil fuel interests a free pass)
Feeling guilty? Feeling helpless?
(laughing emoji from fossil fuel boardrooms)
Recognising our agency
We are told by some progressive politicians and commentators that it’s all about system change, and that we should reject the idea that it is our fault. We can’t take an EV Bus if there is a bad bus service (and they are still run on diesel), we need to invest in rural public transport not just in the cities.
There is a lot of truth in this, but it isn’t quite that simple.
We are not separate from the system, and it is hardly ‘systems thinking’ to imagine such a separation. The system includes Government, business, civic society and the natural environment, interacting in numerous ways.
Citizen-consumers have a lot of identities (community members, consumers, voters, parents, volunteers, etc). These identities each have their own form of agency, which we can choose to use. We need the spirit of positive change in the choices we make:
To choose who to vote for.
To chose where we spend our money.
To choose where to go on holiday and how to get there (and if/how often to fly).
To modify our diet (reducing meat if not eliminating it).
To decide to buy quality clothing that is repairable (looking and feeling better).
To decide where we bank and where we invest through our pensions.
Even when an action one would like to take (like getting an EV) is not yet in reach, one can keep exploring options and set a goal for when it does come within reach.
Setting goals too is an achievement.
The shaming tactic of the fossil fuel interests is aimed at breaking our sense of agency. We have to organise and support each other and reclaim our agency, as individuals and as communities.
The Take The Jump initiative [4] espouses practical steps we can take, while recognising we also need system change.
Electrification of energy end-use is a key threat to fossil fuel interests
There are a range of solutions available now to make a serious dent in our carbon emissions. The most significant and relatively easy thing to achieve is to electrify our primary energy and energy consumption. These solutions are so brilliant they have become a threat to fossil fuel interests, notably:
Electric Vehicles (EVs) of all kinds will not only clean up our towns and cities but are so much more efficient than their fossil fuel alternatives. They require only a third of the energy of a petrol/ diesel car to run them.
Heat Pumps are so much more efficient than their fossil fuel alternatives. They require between a third and a fifth of the energy needed to run a gas boiler.
Both EVs and Heat Pumps are powered by electricity. When generated by solar and wind, it is both free and unlimited, because it is derived from the Sun (which deposits 10,000 times as much energy on Earth as humanity is ever likely to need).
There has been an incessant effort by the network of fossil fuel interests to plant stories and create memes aimed at trying to undermine this transition to clean, electrified energy use.
They know they will eventually lose, because the science of thermodynamics and economic reality mean it’s inevitable. Yet they will try to delay the transition for as long as possible. They can then extract as much fossil fuels as they can, and avoid ‘stranded assets’. Whereas, if they truly cared about climate change they would be working to leave it in the ground.
This essay is not the place to enumerate every myth and piece of disinformation that relentlessly circulates on social media about EVs and Heat Pumps. Carbon Brief have done the myth busting for you [5].
Climate Shaming 3.0: It’s ok for you woke well-to-do!
In order to counter this threat a new form of shaming emerged, particularly in relation to personal choice. I’m calling it Climate Shaming 3.0.
If one believed the framing so often evident in right-wing papers like the Mail and Telegraph titles, EVs and Heat Pumps are (paraphrasing)
… for the woke well-to-do – something they can afford but is not any good for most people …
If it was only these usual suspects one might try to shrug off this chatter.
Unfortunately, there has emerged an unholy alliance amongst those who would regard themselves as green progressives (in a non political sense), who are in a way doing exactly what the fossil fuel messaging is intended to promote.
We have politicians of all kinds who have been cowed by toxic reporting on heat pumps who – wanting to show they are addressing fuel poverty – will talk endlessly about the need to insulate homes. Yet they dare not use the words ‘heat pump’ for fear of being accused of elitism (even though a heat pump is a far more cost-effective route to decarbonising heating than deep retrofit [6]).
They must be laughing their heads off in the boardrooms of fossil fuel companies.
Is it really ‘climate justice’ to promote the poorly designed ECO (Energy Company Obligation) scheme that the NAO (National Audit Office) declared [7] has been a total failure? NAO found that external wall insulation, for example, has led to bad and often exceptionally bad outcomes 98% of the time. This has required very expensive re-work in many cases, compounding the injustice.
This is to be contrasted with the BUS (Boiler Upgrade Scheme) that – despite all the claims about a lack of skills in the sector – has helped to really pump prime the heat pump sector and can be regarded as a success.
Communities like Heat Geek are really shaking things up too, to lower installation costs and improve the quality of installations (to the level already practiced by many small businesses with great track records).
The unholy alliance extends to plumbers, retrofit organisations, council officers, architects and politicians who claim you cannot heat an old building without deep retrofit. A disproven and false claim, but repeated as many times as the story about British pilots seeing better in WWII thanks to eating carrots.
Some untruths live on through repetition.
The idea that we can insulate our way out of energy poverty, without also pushing at least as hard on rolling out heat pumps (individually or using shared heat networks) is an illusion, that would mean we’d be stuck with burning gas for much longer than necessary.
More laughter from those boardrooms.
Insulation, replacing windows and other fabric measures are important but you can easily blow so much money on these that you leave nothing in the pot for a heat pump [6].
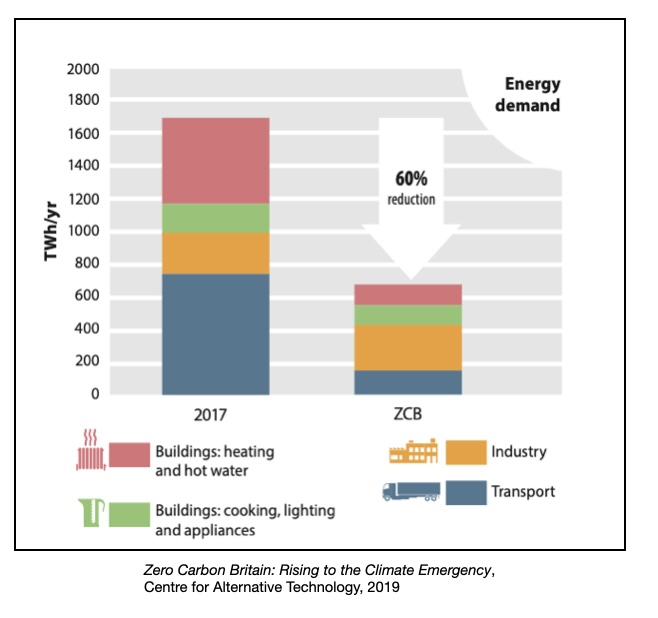
Here is a diagram from Nesta that was based on one I originally produced and here I have added some further annotations (see [6] for Nesta version):
That is not climate justice, or fair on anyone.
It is not climate justice for those in energy poverty to have to pay for gas that will inevitably go through repeated market crises and cost spikes in its dying decades.
Climate justice is future proofing our electricity supply, the grid, our homes and our streets.
These will then be not only cleaner and more efficient but future proofed. As the late Professor Mackay observed, once you have electrified end use of energy, the electricity can come from anywhere: from your roof, from a community energy project, or from a wind farm in the north sea.
It’s time that those that claim to be progressives stopped falling for the tactics of fossil fuel interests, that time and again are slowing our transition to a clean energy future, and action on climate change.
It started with shaming people for their consumption. Let’s not fall for the new tactic of shaming those who actually care enough to adopt effective solutions.
References
[1] Merchants of Doubt: How a Handful of Scientists Obscured the Truth on Issues from Tobacco Smoke to Global Warming, Naomi Oreskes and Erik M. Conway, 2010, Bloomberg Press.
[2] Exxon Mobil’s Messaging Shifted Blame for Warming to Consumers, Maxine Joselow & E&E News, Scientific American, 15th May 2021.
All the talk of the ‘spark gap’ – the particularly high ratio of electricity unit prices to gas unit prices – might deter people from getting a heat pump, because they think it will mean they will pay more for their heating than they do currently, but this is false in the majority of situations where householders are end-of-lifeing their old gas boiler.
Let’s run the numbers.
Take a building that currently that consumes 30,000 kWh of gas for heating per year.
At a gas unit price of 6p/kWh that totals £1,800 per year (for the moment, ignoring standing charges for simplicity)
Let’s assume the old gas boiler is 75% efficient (in many cases with will be quite optimistic).
So, building actually needs 22,500 kWh of heat reaching radiators (0.75 x 30,000 = 22,500).
So the question is, can a heat pump be cheaper to run with its high relative performance that counteracts the ‘spark gap’? Let’s see …
Let’s assume a reasonable minimum achievable heat pump system SCOP of 3.5
So heat pump needs 6,429 kWh of electricity to produce 22,500 kWh of heat ((22,500 / 3.5) = 6,429)
At a electricity unit price of 22p/kWh that totals £1,414 per year
That is a saving of £386 on running costs
Health Warning: The difference is very sensitive to the ‘spark gap’ (ratio of electricity to gas unit prices), and crucially the SCOP.
Now, I am not saying there is not an issue with the ‘spark gap’. Adoption rates in Europe show that the smaller the spark gap, the high the adoption of heat pumps (see ‘Figure 2.4 Comparison between the heat pump market share, the number of heat pumps installed, and electricity and gas price ratio for countries in Europe in 2023’, Progress in reducing emissions – 2025 report to Parliament, 25 June 2025).
However, when people talk about the spark gap they seem to assume the context is ‘buy a new gas boiler or buy a heat pump’. Needless to say that is a higher bar but not an insurmountable one. Many people who are concerned about climate change and have an ageing gas boiler simply want to know that their heat bills will not rise.
Now back to standing charges. I rerun the numbers for different SCOPs and included standing charges (see NOTES for assumptions). The ‘breakeven’ SCOP is then close to 2.9, which frankly only an incompetent heat pump installer would fail to exceed.
And what is more, for any of these SCOPs the carbon saving is at least 4 tonnes of carbon dioxide equivalent per year. So both the planet and the bank balance can be happy with the choice.
So, let’s fix the spark gap, but stop banging on about it as though it is a reason not to press on with rolling out heat pumps.
(c) Richard W. Erskine, 2025
NOTES
Assumptions used in table: With heat demand of 22,500 kWh and old gas boiler with efficiency of 0.75 (75%), so gas bill showing 30,000 kWh primary energy used by gas boiler. Used standing charges of 28p and 59p per day for gas and electricity, and unit rates of 6p/kWh and 22p/kWh, respectively. The breakeven running costs SCOP in this case is 2.935. Also, a carbon intensity of gas of 184 gCO2/kWh and for UK electricity grid (for 2024) of 124 gCO2/kWh; so even at a SCOP of 2.5 you save 4.37 tonnes of CO2 a year.
Most people have heard about chaos theory, especially as it applies to weather, but may be a little fuzzy about what it all means. They may even hear people claim “if they can’t even predict the weather in a month’s time, how on earth can they tell us what the climate will be in 25 years time?!”.
It’s a fair challenge, but one that has been answered many times by climate scientists [1], but often in ways that perhaps are not as accessible as I feel they could be. When I was recently asked this question I was frustrated I could not share a plain English article with them.
So here is my attempt in plain, non-scientific language to explain how we can project future climate, despite ‘chaos’. I will use the analogy of rolling dice to help explain things – so no equations or mathematical jargon, I promise.
Chaotic Weather
Let’s start with the discovery of ‘chaos’ by Lorenz in 1963 [2]. Weather projections have to start from the current state of the weather and then project forward. The models incrementally step forward to see how the weather patterns evolve over minutes, hours and days. Lorenz discovered that even with the simplest models, if one did two ‘runs’ of the model which had an infinitesimal difference in initial conditions (eg. the temperature in Swindon at 15.0oC and 15.00001oC) the predicted weather can look very different in just a few weeks..
If this was just a trivial observation that errors can magnify themselves in a complex system, one might be tempted to shrug one’s shoulder – and it was not even a new insight [3]. But Lorenz discovered something far more profound: beautiful patterns amongst the chaotic behaviour of complex systems (think of the eddy currents that appear in the turbulent flow of a river). For those interested in learning more about Lorenz’s mathematical legacy, Professor Tim Palmer gave an interesting talk on this [4].
I say ‘errors can magnify’ because sometimes you end up with a chaotic outcome and sometimes you don’t [5]. This is important if you are about to head off to Cornwall for your summer holiday. Weather forecasters now do multiple runs of the models varying the initial parameters [6]. If all the outcomes look similar then the weather system is not behaving chaotically – at least over Cornwall for the period of interest – and the weatherman can say confidently “it will be dry next week over Cornwall”. If, however, out of 100 runs, 20 indicate wet and windy weather, and the rest were dry, they’d say “There is a good chance of dry weather over Cornwall next week, but there is a 20% chance of wet and windy weather”, so take your waterproofs!
Predictable Climate
It really is all about the question being asked, as with most issues in the world. If you ask the wrong question, don’t be surprised if you get a misleading answer.
If I ask the question “will it be sunny in Cornwall on the 3rd of July of 2050?” (wrong question) then it is impossible to say, because of ‘chaos’. If, on the other hand, I ask the question “do we expect the average temperature over Cornwall to be higher in the summer of 2050 as a result of our carbon emissions compared to what it would have been without those emissions?” (longer but valid question) I can answer that question with confidence; it is “Yes”.
This illustrates that when we talk about weather we are interested, as in our holiday plans or a farmer harvesting their crops, in the specific conditions at a specific place and specific time.
Climate is very different, because it is about the averaged conditions over a longer period and typically wider area.
Throwing the dice
I want to illustrate the difference between these two types of question (specific versus averaged) by use of a dice [7] analogy.
If I throw a dice I expect that the chance of getting a 6 to be 1 in 6. If I ask the (specific) question ‘what will the hundredth throw of the dice show?’ (think weather), I am no more certain of the outcome than after 10 throws [8].
Now ask a different question: ‘what will be the average number of 6s after 600 throw?’ (think climate). I would expect it to be around about 100. As the number of throws increases I’d expect the average (number of 6s divided by the number of throws) to get closer and closer to 1 in 6.
This is just how statistics comes to the rescue in the face of the much used, and abused, “chaos” in the climate debate.
You can do this yourself. Make multiple throws of a dice, and after each throw, take the count of the number of 6s thrown and divide by the number of throws – that is the observed odds. You might be surprised to find how long it takes before the odds settles down to close to 1 in 6.
Being lazy, I wrote a little program to plot the result (using a random number generator to do the ‘throwing’ for me).
The averaged number of 6s converges on the expected odds of 1/6 (shorthand for ‘1 in 6’).
I then imagined two dice, one that was ‘fair’ (where the odds of throwing a 6 were 1 in 6) and a ‘loaded’ dice (where the odds have changed to 1 in 5). This is a analogy for a changed climate where carbon emissions have been happening for some time but have now stopped, and there is a raised but stable concentration of greenhouse gases in the atmosphere. This gives rise to a higher averaged temperature, represented by the higher odds of throwing a 6 in this analogy (see next illustration).
Despite the uncertainty in any specific throw (think weather) in both cases, the average chance of getting a 6 can be predicted (think climate) in both cases. We can see the loaded dice clearly in the graph, compared to the fair dice. In both cases it takes a little time for the influence of randomness (chaos if you like) to fade away as the number of throws increases.
However, the emissions have not stopped, and in fact have been growing since the start of the industrial revolution. There has been a significant acceleration in emissions in the last 75 years. So the amount of accumulated greenhouse gases in the atmosphere has been growing, and with it, the averaged surface temperature on Earth.
So, taking the analogy one step further, I created a dice that gets progressively more ‘loaded’ over time (think each year of emissions).
Now, the averaged chance of throwing a 6 will progressively increase, compared to the fair dice. This is illustrated in the next graphic.
Again, we see the averaged odds after a number of throws jump around for quite a while (think chaos), but things settle down after a several hundred throws.
We now see a clear and ever widening gap between the two dice.
This is analogous to what is happening with our climate: our continuing carbon emissions are progressively loading the ‘climate dice’.
No amount of weather chaos can cancel the climate statistics that become more evident with every year that passes.
Extreme WeatherEvents
Now while weather and climate are different, because climate is an average of what the weather is over time, there is an interesting flip-side to this. Since the climate changes due to our carbon emissions, that means the spread of possible weather must have also shifted, to generate a new average.
This means that extreme weather events become much more likely.
Once again, this is just basic statistics. So events that may have been “one in a hundred years” become much more frequent, and very extreme events, like the 40oC we saw in England in 2022, that were “basically impossible” without our carbon emissions [9], now start to happen.
I don’t want to make this essay longer explaining how this works, and the Royal Statistical Society have done a great job on this, so please visit their explainer [10].
Extreme weather events are now popping up all over the world, almost on a weekly basis, and thanks to the statistics and associated modelling, scientists can now put a number on how much more likely each event has become due to our carbon emissions [11].
We have already loaded the climate dice, the question now is, how much more do we want to load it, and make the odds even worse?
Over the specific place and time period of interest, of course.
This is called ‘ensemble modelling’.
For the grammar police: common usage now prefers ‘dice’ for singular and plural cases.
In this sense, the dice analogy is somewhat different to climate, because climate change is conditional on what came before, but this does not change the point of the analogy – to distinguish between specific and averaged questions.
I respect those wishing to protect nature who are worried about unrestrained infrastructure projects, but the ‘unrestrained’ bit was never part of the plan, and strawman arguments now abound, such as the claim we will be building solar farms on prime arable farmland.
An astonishing 30% of UK land is devoted to grazing, and raised solar arrays can co-exist with grazing, even providing shade during heatwaves. It may even pay back some of the carbon impact of those methane burping ruminants. Solar grazing (or agrivoltaics) is now a thing in some countries so why is it not supported by organisations like the CPRE in the UK?
I have concerns about the impact of progressive weakening of the Government’s new infrastructure policies that may continue the blocking or delaying of essential on-shore renewable energy projects.
In his seminal book over 15 years ago, Professor David Mackay wrote1:
If the British are good at one thing, it’s saying “no.”
No to this solar farm; no to that wind turbine on that hill; no to that wind farm off my coastline; etc.
This, despite the fact that the Government’s most recent public opinion survey2 shows 80% are in favour of renewables; although when it comes to on-shore wind and solar farms in one’s locality, this drops to 37% and 47%, respectively.
Is this because the public are not aware of the benefits of local energy production? Or because not enough of it is community owned? Is it that people do not understand the nature of the emergency we face and the imperative to act?
We’ve seen over the sequence of three heatwaves3 recently (heatwaves that have been made much more likely due to man-made global warming4) that our beloved commons around Stroud now look more like the Serengeti than our green and pleasant land. This will be the new norm by 2050 if we don’t urgently address our emissions.
At this stage in the climate emergency, climate inaction is tantamount to climate denial.
The Climate Change Committee has made it abundantly clear that we need to electrify most of our economy to get to net zero expeditiously and affordably5: This applies to both generation and consumption:
“In many key areas, the best way forward is now clear. Electrification and low-carbon electricity supply make up the largest share of emissions reductions in our pathway, 60% by 2040. Once the market has locked into a decarbonisation solution, it needs to be delivered. The roll-out rates required for the uptake of electric vehicles (EVs), heat pumps, and renewables are similar to those previously achieved for mass-market roll-outs of mobile phones, refrigerators, and internet connections.”
and really at a much lower costs than many have claimed:
“We estimate that the net costs of Net Zero will be around 0.2% of UK GDP per year on average in our pathway, with investment upfront leading to net savings during the Seventh Carbon Budget period. Much of this investment is expected to come from the private sector.”
Much has changed since David Mackay wrote his book. The costs of renewables has dropped, so they are now the cheapest form of energy (and onshore cheaper still).. Yet I believe another kind of “No” has developed in the dialogue around renewables infrastructure.
There has emerged a false dichotomy between green energy infrastructure and nature. The case often presented is that to protect nature we have to limit infrastructure to only those places which no one cares about, like brownfield sites, which of course would completely undermine any attempt to reach the levels of onshore wind and solar that are needed to supplement off shore development. Whereas there are many things harming nature which are much worse including farming systems, tidy gardens, and climate change itself.
Take the rewiring of our electricity grid that is needed for an electrified economy. The case is made for burying cables as opposed to pylons because it is assumed they are environmentally less harmful, and despite the enormous increase in capital costs (and hence delays) that would result. In fact, burying the quite different ultra expensive cables needed in wide trenches can have impacts on flora and fauna, such as harm to tree roots and subsoil ecology, that can exceed those arising from pylons.
Isn’t the honest truth that people simply don’t like their view being changed by the addition of renewables to the landscape and some use the nature card to avoid being labelled NIMBYs? I fear so.
Rodborough Common 19th Juky 2025 by Richard Erskine
Conversely, we can fail to act and our grandchildren will see a landscape changed forever by our inaction. The MetOffice’s most recent State of The Climate report6 states that under the intermediate pathway scenario (RCP4.5) “years 2022, 2023, and 2024 would likely be considered average by the 2050s and cool by around 2100”. Is that preferable to some wind turbines today offering local energy security and resilience, helping the local community do its part in decarbonising our economy?
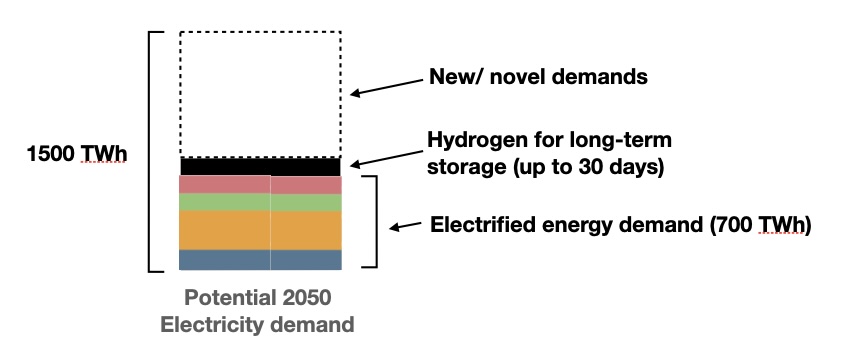
The good news is that because of the enormous efficiencies of electrification and the end of burning fossil fuels, the primary energy required from renewables – about 800 TWh per year – would be about one third of the primary energy hitherto required from fossil fuels. Even if we almost double this – to allow for new demands like synthetic meats, AI, minerals recycling, etc – to about 1500 TWh, an Oxford University study7 shows wind and solar can power the UK. As Hannah Ritchie summarises the findings8:
“They think there is a large potential for offshore wind. This would be spread over 10% of the UK’s exclusive economic zone. Onshore wind could be used on 5% of British lands, and combined with farmland. 2% of British land would be used for solar PV, and could also be combined with farmland using a technique called ‘agrivoltaics’. Rooftop solar doesn’t add much – the output is quite small, even if 8% of British rooftops are covered. Definitely still a good option for individuals, but maybe not for the nation as a whole.”
For those that say let others do it, because we are special, don’t be surprised if everyone claims the same. It is analogous to a parent who says let other children take the vaccine (while their child benefits from community immunity so they can avoid the very small risk of side effects of inoculation). If everyone made that choice, everyone is at risk.
Have we, in short, become too selfish to take the steps to act with the urgency needed to actually take declarations of a climate emergency seriously; to go beyond laudable actions like recycling to really substantive endeavours?
We need to make the difficult decisions needed but work hard to take people with us, rather than stoke fears as some political parties choose to. The political debate has created some surprising bedfellows amongst those opposing onshore renewables projects.
UK news coverage just triggered me so please excuse me but really …
Good news: the coverage of heatwaves is drawing the link with climate change on BBC and C4.
Bad news: there seems to be a lot of surprise at this! The dry conditions and repeated heatwaves, causing head scratching on questions like ‘who knew?’, ‘does this herald worsening heat extremes?’, etc.
Well hello people, this has all been completely obvious to scientists studying climate since at least the 1970s, but society has gone along with denial (yep, we’re all in denial, to some degree).
People talk about the elephant in the room – the thing no one has mentioned but really should not have been ignored. Well, here we have the scientists in the room, including the news room, and now regularly demonstrating the long prediced link between man-made global warming and extreme weather events and episodes..
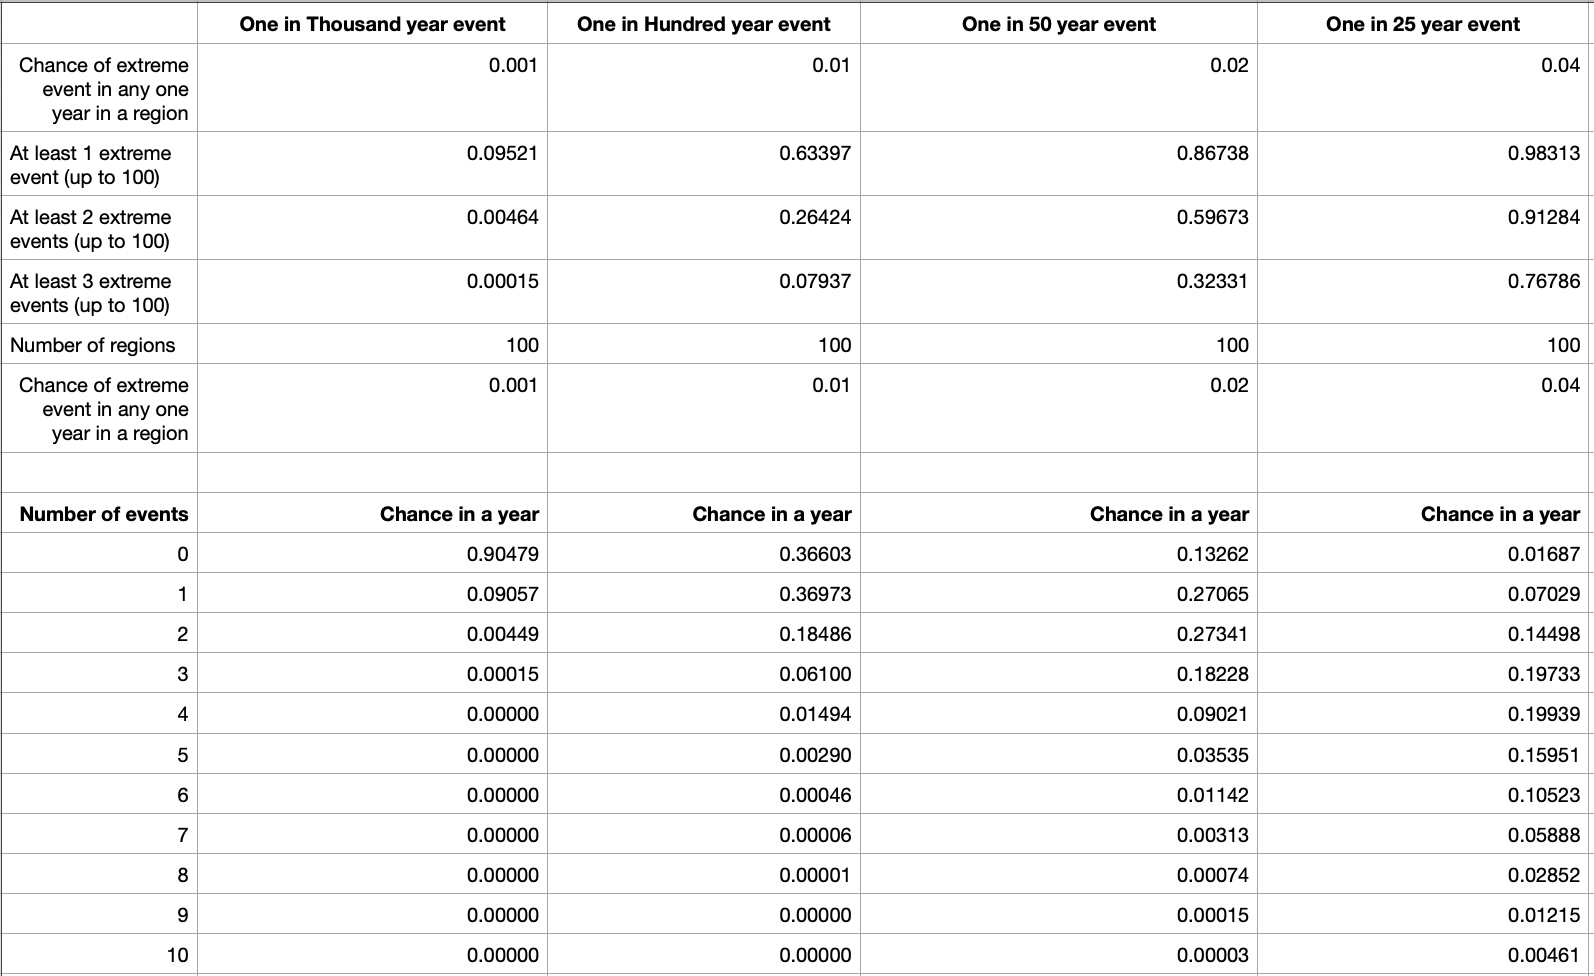
The Metoffice produces frequent decadel forecasts that few read, and then people get surprised when we have another 100 year heat wave or 100 year flood (following the last one 5 years ago; remember 40C in UK in 2022).
When the odds keep changing the use of the phrase “100 year event” we heard from ‘the orange one’ in relation to the deadly Texas floods, is meaningless, and misleading, but unsurprising from someone who is well into his mission to dismantle the USA’s climate science capacity, weather forecasting, and ability to adapt and respond to extreme weather events (driven by man-made climate change that is the underlying driver).
Switch off if you want to, but the simple truth is that every tonne of carbon dioxide we emit cumulatively turns up the climate one-way ratchet and increases the risk of extreme weather events (at both ends of the hydrological cycle, because warmer air holds more water).
More emissions. The dice gets loaded a bit more. The odds get changed a bit more. Repeat.
At this rate, by 2100, my great grandchildren will yearn for the (relatively) cool summers of the 2020s.
And because CO₂ is a long lived greenhouse gas, don’t expect the atmospheric concentration of it to fall anytime soon. Ratchets turn in one direction. Give it hundreds to many thousands of years before long-term carbon cycles begin to reduce atmospheric concentrations to comfortable levels for humanity, but by then on a changed planet.
Prevention is better than cure with a vengeance in this case.
Worried about heatwaves? You should be but please, don’t be surprised.
“We estimate that the net costs of Net Zero will be around 0.2% of UK GDP per year on average in our pathway, with investment upfront leading to net savings during the Seventh Carbon Budget period. Much of this investment is expected to come from the private sector.”
And 0.2% of roughly £3 billion of GDP is just £6 billion a year (and most coming from industry), less than what the UK spends on fizzy drinks. Even the Government’s spending watchdog agrees. And what a fabulous investment with huge ROI (Return On Inhabitability). The costs of inaction make the costs of action look small by comparison.
Reject the populist, science rejectionists, who think denial wins votes.
I’ll always vote on behalf of those who come after us who I hope will be wiser, less selfish and less ignorant than our generation have been, yet will feel the full force of our failure to take urgent action when we should have.
Yet, it is not too late for us to reduce harms. The harm-free-option ship has sailed, but every tonne avoided makes a difference, and reduces the level and frequency of extremes to come.
I was excited to get my hands on Jean-Baptiste Fressoz’s latest book More and More and More – An All-Consuming History of Energy [1]. He offers up a very lively critique of the notion of historic energy transitions – from wood, to coal, to oil and gas.
His methodology aims to show how material flows are intimately linked to energy production in often surprising ways over time. For example we needed wood as pit props to mine coal, and in surprising quantities. Most of the book is devoted to examples of the symbiosis that has existed between the successive materials required to meet our energy needs. He mocks the idea of energy transitions with numerous well researched anecdotes, awash with surprising numbers. It is an entertaining read I would recommend to anyone.
However, I was expecting the book would close with some prescriptions that would show how the “amputation” the blurb called for could be achieved, but in the end he tells us he offers no solutions, or “green utopias”, as he discussed in an interview [2].
In the finale, he presents the newest energy transition – towards a world powered by renewables – as just the latest incarnation of a delusional concept, but largely abandons his methodology of using numbers to prove his case. I wonder why?
He does not deny the reality of a need to reduce carbon emissions, or the science of climate change, but it is clear he sees humanity’s insatiable appetite for energy as the central issue that must be addressed. He could have written a different book if that was his objective.
There are fundamental flaws in Fressoz’s scepticism of the renewables transition.
Solar abundance
The first of these is that the new source of energy that supplies our energy in a renewables future is our sun. Energy from the sun is a quite different category to that we extract from the ground.
The most pessimistic projection is that humanity, or what we may become, will have hundreds of millions of years left of usable energy from the sun [3]. No digging or extraction required. I’d call it functionally infinite on any meaningful timescale.
Not only that, but the sheer power of the sun’s energy is awesome, which we capture as wind, through photovoltaics, and the ambient energy harvested by heat pumps. As Frank Niele observed 20 years ago [4]:
“The planet’s global intercept of solar radiation amounts to roughly 170,000 TeraWatt [TW] ( 1 TW = 1000 GW). … [man’s] energy flow is about 14 TW, of which fossil fuels constitute approximately 80 percent. Future projects indicate a possible tripling of the total energy demand by 2050, would correspond to an anthropogenic energy flow of around 40 TW. Of course, based on Earth’s solar energy budget such a figure hardly catches the eye …”
It is clearly a category error to compare renewables with fossil fuels.
False equivalence
Ah, but what about the lithium and all those (scare story alert) “rare earths” needed to build the renewables infrastructure. This is the second flaw in the Fressoz thesis. The example of wood consumption for mining staying high even after the ‘transition’ to coal, is an example of an essential material relationship between the kilowatt-hours of energy produced and the kilograms of material consumed. This link does not exist with renewables to any meaningful degree.
It has nevertheless become a popular belief amongst those questioning the feasibility of renewables. For example, Justin Webb on BBC Radio 4 [5] posed this question:
“Is it also the case of us of us thinking whether we can find some other way of powering ourselves in the future … [we are] just going from taking one out of the ground – oil – into taking another thing or another set of things just isn’t the answer, isn’t the long-term answer for the planet.”
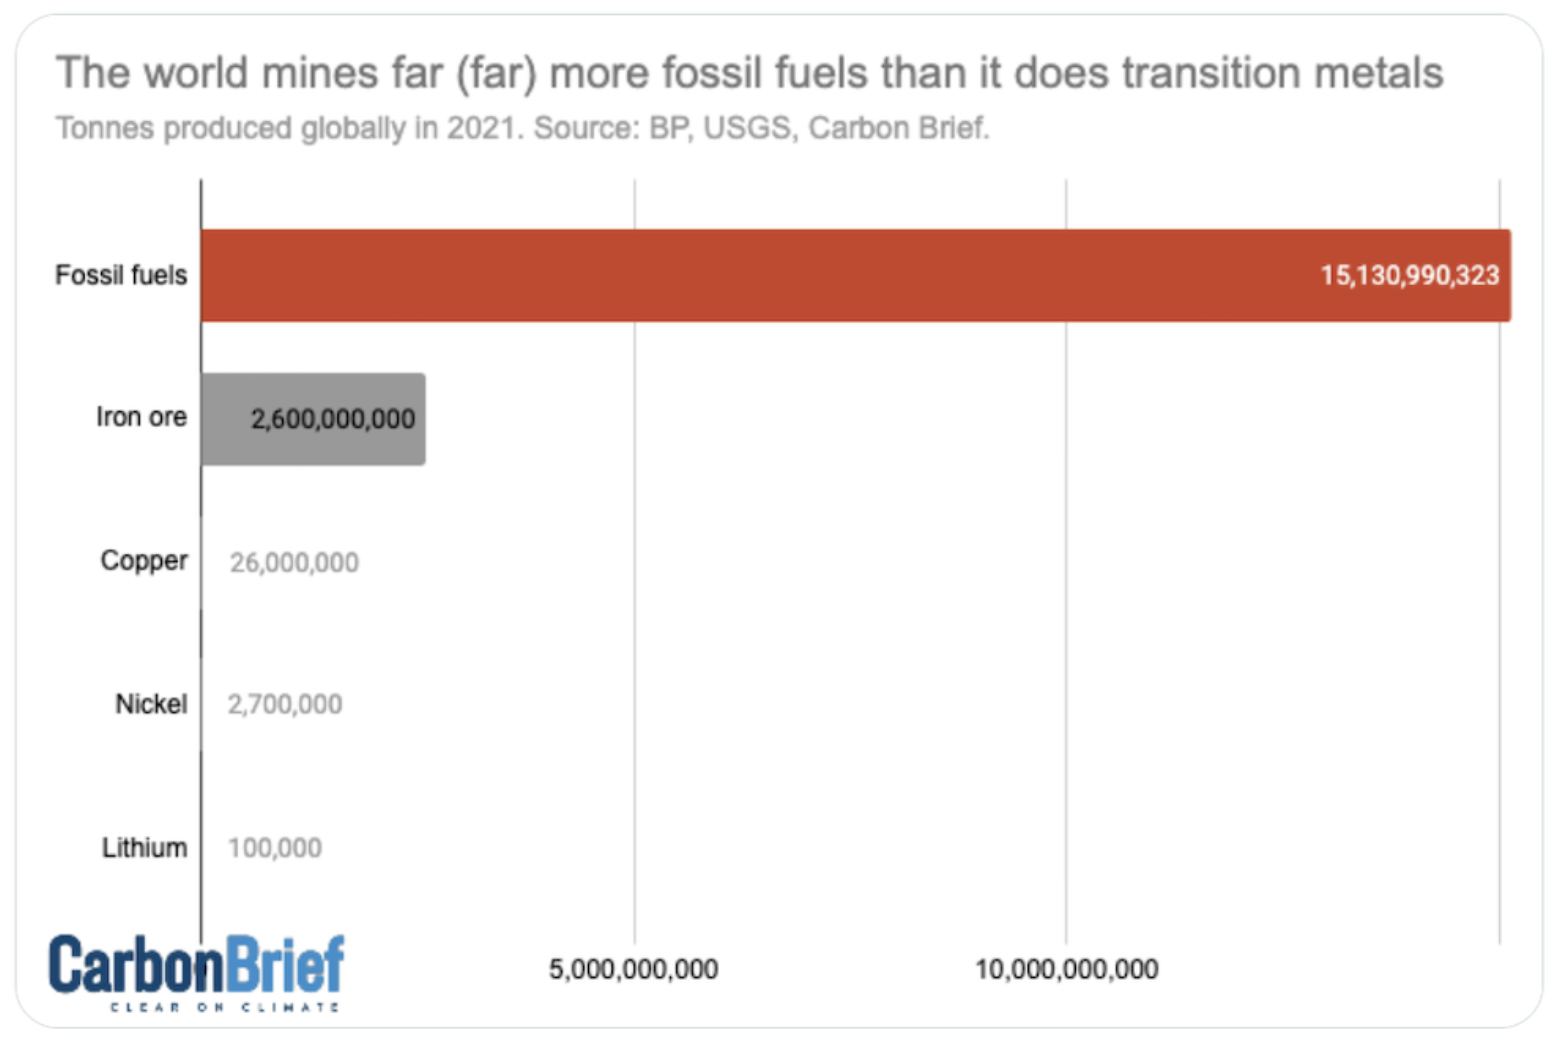
This is another category error that unfortunately Fressoz seems happy to go along with. The quantities of minerals required is minuscule compared with the huge tonnage of fossil fuels that has powered our carbon economy, as CarbonBrief illustrated as follows, as part of a debunking of 21 myths about Electric Vehicles [6]:
Credit: CarbonBrief
This false equivalence between minerals extraction and fossil fuels extraction is now widely shared by those who prefer memes to numbers.
A detailed published analysis of the demands for minerals required to build out renewables infrastructure by mid century shows we have enough to do this, without assuming high levels of recycling [7]:
“Our estimates of future power sector generation material requirements across a wide range of climate-energy scenarios highlight the need for greatly expanded production of certain commodities. However, we find that geological reserves should suffice to meet anticipated needs, and we also project climate impacts associated with the extraction and processing of these commodities to be marginal.”
Yet many commentators claim we are in danger of running out of ‘rare earths’ (which they conflate with minerals in general).
Beyond that, it is true that for many minerals it is cheaper to mine them rather than recycle them but Fressoz claims (p.218) “recycling will be difficult if not impossible”. There is no scientific basis for that claim. By 2050, one can expect that better design, improved technologies, economic incentives, and global coordination will become widely effective in tilting the balance to recycling rather than fresh extraction (and energy inputs to do this will not be an issue, as noted earlier).
And once you have built a wind farm it will continue to provide energy powered by the wind for a few decades (which is powered by the sun), without the need for material extraction or material inputs, and the faster this is done, the cheaper it gets, saving trillions of dollars [8].
A renewables circular economy is perfectly feasible, following the initial build out of the new infrastructure by mid century, with abundant energy from the sun powering the recycling needed to maintain and refresh that infrastructure.
Intermittency and grid stability
It is sad that Fressoz decides to play the it-doesn’t-always-shine card when he writes (p. 212):
“At the 2023 COP, the Chinese envoy explained that it was ‘unrealistic’ to completely eliminate fossil fuels which are used to maintain grid stability”.
… as though that settled the argument. They may have said this for UNFCCC (UN Framework Convention on Climate Change) negotiating reasons, but it is frankly pretty depressing that Fressoz shared this quote as though it reflected current informed opinion on power systems.
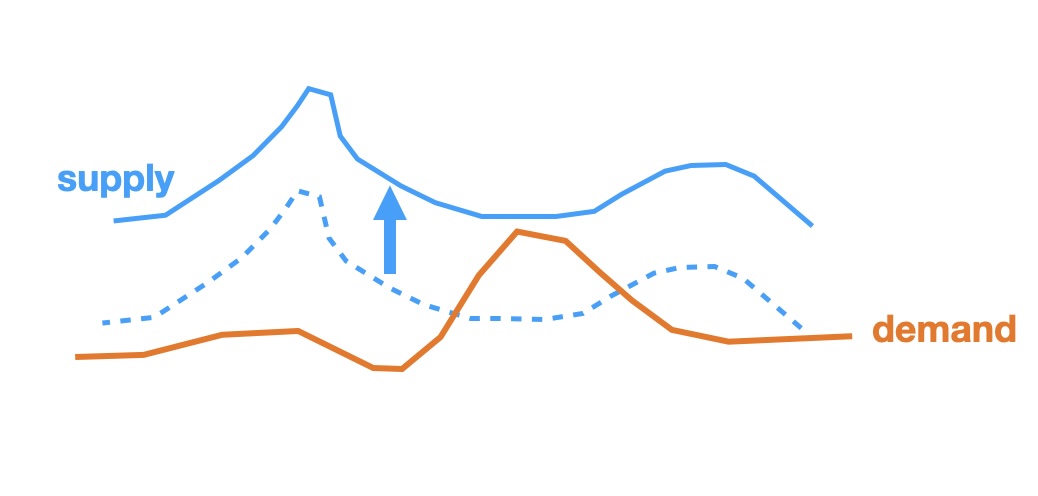
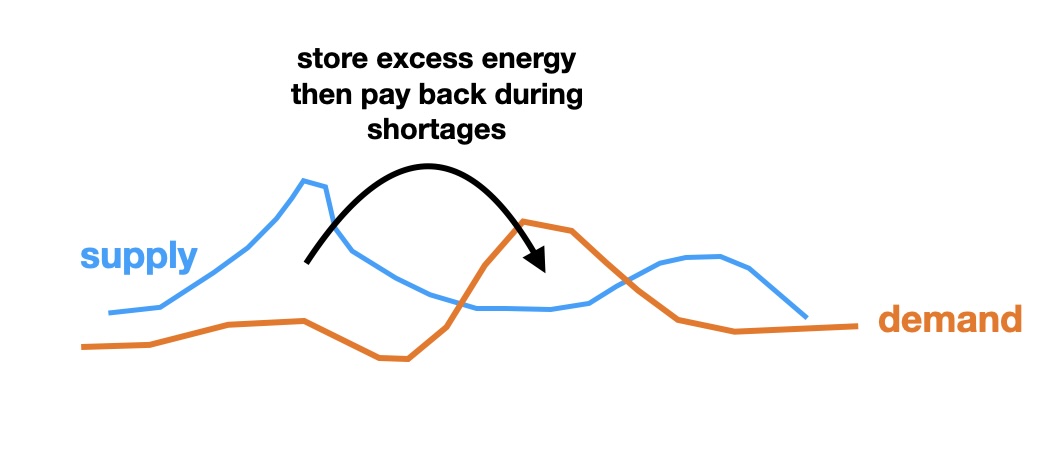
Firstly, even fossil fuelled generation in the early 20th Century needed flywheels to level out energy supply, and in so doing, maintain grid frequency. Such devices can live on in a renewables dominated grid. More likely is the emergence of ‘grid forming inverter’ technology that can replace inertial forms of frequency response such as flywheels and turbines.
Secondly, there are several other ways in which a grid that is 100% based on renewables can remain stable, including what is called ‘flexibility’ (including demand shifting), and distributed energy storage.
The UK is rolling out a lot of battery storage, and these have the benefit of being able to be both large and small to support the network at local, regional and national levels. Battery Energy Storage System (BESS) technology is already making an impact in the UK, Australia and elsewhere [9] demonstrating the resilience that can be achieved in a well designed and well managed grid:
“Recently, a major interconnector trip sent the UK’s grid frequency plummeting. At around 8:47am on a morning in early October [2024], the NSL [North Sea Link] interconnector linking the UK and Norway, suddenly and with no warning, halted … with immediate and potentially disastrous impact on the UK’s electricity grid … battery energy storage systems (BESS) answered the call. Across NESO’s network [National Systems Energy Operator], 1.5GW of BESS assets came online to inject power into the system, bringing frequency to strong levels within two minutes.”
Far from renewables infrastructure causing a blackout, it prevented it. Other countries can learn from this (side eye to Spain!).
A near 100% renewables grid is well within the reach of countries like Australia, and others are not far behind [10]
As the infrastructure scales up, additional storage will be added, to deal with rare extended periods of poor sunlight and low wind. The Royal Society has provided recommendations [11] on how to handle such extreme episodes.
The Primary Energy Fallacy & Electrification
While Fressoz does talk about the efficiency arising from new forms of production and consumption, he does not really chose to provide any numbers (which is in stark contrast to the slew of numbers he uses when talking about wood, coal, oil, etc.).
He then makes the point (p. 214):
“In any case, electricity production accounts for only 40 per cent of emissions, and 40 per cent of this electricity is already decarbonised thanks to renewables and nuclear power.”
He channels arguments that readers of Vaclav Smil will be familiar with. Telling us how hard it will be to decarbonise steel, fertiliser production, flying, etc.; no solutions, sorry.
Even S-curves (that show how old technology is replaced by new) are disallowed in Fressoz’s narrative, because they are too optimistic, apparently, even though there is empirical evidence for their existence [12].
Just a ‘too hard’ message.
What he fails to mention is that the energy losses from using fossil fuels are so large that in electrifying the economy, we will need only about one third of primary energy hitherto needed (using renewables and nuclear). So, in the UK, if we needed 2,400 TWh (Terawatthours) of primary energy from fossil fuels, in an electrified economy powered by renewables, we’d only need 800 TWh to do the same tasks.
The efficiencies come both from power production, but also from end use efficiencies, notably transportation and heating. By moving to electric vehicles (trains, buses, cars) and heat pumps, we require only one third of the energy that has hitherto been used (from extracted coal, oil and gas). This is massive and transformational, not some minor efficiency improvement that can be shrugged off, as Fressoz does,
Green production of steel, cement and fertiliser is possible and in some cases already underway, although currently more expensive. Progress is being made, while flying is more difficult to crack. Together these sectors account for about a quarter of global emissions. Yet, road transport and heating together also represent about quarter of global emissions [13], and are easy to decarbonise, so I guess don’t fit into the book’s narrative.
The surprise for many, who are effectively in thrall to the primary energy fallacy, is that we can raise up the development of those in need while not necessarily increasing the total energy footprint of humanity. We can do more and more, with less!
Who is deluded?
In his essay The Delusion of “No Energy Transition”: And How Renewables Can End Endless Energy Extraction, Nafeez M Ahmed offers an eloquent critique of Fressoz’s book [14].
A key observation Ahmed makes is that Fressoz’s use of aggregate numbers masks regional variations in a misleading way:
“Because he fails to acknowledge the implications of the fact that this growth is not uniform across the globe at all, but is concentrated in specific regions. The aggregate figures thus mask the real absolute declines in wood fuel use in some regions as compared to the rise in others. Which means that oil and wood fuel growth are not symbiotically entwined at all.”
Ahmed goes on to present the arguments about the different nature of the move to renewables, electrification of end-use and so on, in an eloquent and persuasive way. I strongly recommend it.
Fressoz is right to claim that many have been seduced by a simplistic story about past transitions. His book is very entertaining in puncturing these delusions, but he overplays his hand. Ahmed argues convincingly that Fressoz has failed to demonstrate that his methods and arguments apply to the current transition.
Fressoz’s attempt to conjure up a new wave of symbiosis fails because he misunderstands and misrepresents the fundamentally different nature of renewables.
Is there a case for degrowth?
Of course, we do live in a world of over consumption and massive disparities in wealth (and over consumption does not seem to be a guarantee of happiness).
The famous Oxfam paper on Extreme Carbon Inequality from 2015 [15] showed how the top 10% of the world (in terms of income) were responsible for 50% of emissions, and the bottom 50% were responsible for 10% of emissions. An obscene asymmetry. As Kate Raworth argues in Doughnut Economics, we need to lift up those in need, while reducing the overconsumption of some that threaten planetary boundaries.
Yet we do not help those in poor countries by getting them hooked on fossil fuels. Indeed, renewables offer the opportunity to avoid the path taken by the so called ‘developed world’, and go straight to community-based renewable energy. This can be done – at least initially – without necessarily needing to build out a sophisticated grid: solar, wind, storage and electrified transport, heating and cooking is a transformative combination in any situation. We can increase the energy footprint of the poorest (providing them with the development they need), while reducing their carbon footprint.
Yet many want to play the zero sum game. True, there is a carbon budget (to remain below some notional global target rise in mean surface temperature, we cannot burn more than a quantity of carbon; the budget). We should share it out this dwindling budget fairly, but honestly, will we?
The game is nullified if people simply stop burning the stuff! The sun’s energy is functionally infinite (in any meaningful timeframe), so why not reframe the challenge? How about the poorest not waiting for, or relying on, the ‘haves’ suddenly getting a conscience and meeting their latest COP (Conference Of the Parties) promises? Countries like Kenya are already taking the lead [16].
Energy Independence and Resilience within our grasp
There are of course multiple interlocking crises (climate, nature, migration, water, and more). They are hard enough to deal with without claiming that energy should join them.
The land use needed for our energy needs is small compared to what is needed for agriculture and nature, so again, renewable energy is not part of another fictitious zero sum game involving land use.
A paper from the Smith School in Oxford [17] has found that wind and solar power could significantly exceed Britain’s energy needs. They found that even if one almost doubled the standard estimates of the energy needs (to cater for new demands such as circular economy, AI and synthetic meat in 2050), there were no issues with the area of land (or sea) required:
Solar PV 4% of British Rooftop
Solar PV 1% of British Land*
Wind Onshore 2.5% of British Land
Wind Floating Offshore 4% of UK’s exclusive economic zone.
… and bearing in mind that 30% of land is currently used for grazing.
The scare stories about prime arable land being covered in a sea of solar panels is politically motivated nonsense.
I gave a talk Greening Our Energy: How Soon, on how to understand how the UK has made the remarkable transition from a fossil fuel dominated energy sector to our current increasingly decarbonised grid, and how the journey will look going forward (and in a way that is accessible to lay people) [18].
In a world of petrostates and wars involving petrostates, there has indeed been repeated energy crises, and they will get worse while we remain addicted to fossil fuels.
Transitioning to a green energy future is the way out. It is already under way, we have the solutions. We just need to scale them up, and ignore the shills and naysayers.
Let’s not say or imply that solving the many injustices in the world is a pre-condition to addressing the energy transition. This is the false dilemma that is often presented in one form or another, often from surprising quarters, including ostensibly green ones. It is a prescription for delay or inaction.
Achieving green energy independence and resilience might actually undermine the roots of many of those power structures that drive injustices, because energy underpins so much of what communities need: education, health, food, and more.
John Lennon seems to says it right in his song “Power to the people”.
My short review of ‘The Many Lives of James Lovelock: Science Secrets and Gaia Theory’, Jonathan Watts
If you have been variously inspired, confused and infuriated over the years about James Lovelock, then this wonderful biography is a revelation. It’s a book that is impossible to put down. It explores the deep roots of Lovelock’s brilliant but often idiosyncratic character.
It doesn’t try to offer trite answers to this complex character, but does reveal surprising insights you won’t find anywhere else. It is so revealing that Lovelock’s undoubted brilliance in matters of science, was not matched by an equally advanced emotional intelligence.
Instead, we see an emotional vulnerability that was exploited by dark forces to co-opt him to an industry narrative on several occasions. Ultimately, he acknowledged this. I wonder if it was in part due to his fiercely declared independence, and not to be seen as a leader of a green movement he saw as too susceptible to wooly thinking?
In my mind, his reaction to the green movement was rather in keeping with Le Chetalier’s Principle: a system will react to any constraint so as to oppose the constraint. He might have appreciated that chemistry metaphor! He seemed happier to express contrarian opinions, almost because it ruffled feathers. Unfortunately this then served the needs of those arch Machiavellian manipulators – notably Rothschild and Lawson – who played him, time and again. His need to please in such cases seemed to override his critical faculties in political matters, which he was so ill equipped to deal with.
The lasting feeling I had on finishing the book was one of poignancy. Lovelock achieved so much, and recognition aplenty, but he was never quite rewarded with the recognition of mainstream science he seemed to both recoil from but also craved.
At first I wondered how a biography whose chapters were titled by the key people in his life could work, but it worked brilliantly. The themes – a love of nature, invention, multidisciplinary problem solving, bombs and more – run through the book like a piece of Brighton rock, as does the evolution of the Gaia vision, from a formative idea to a fully fledged form that finally achieved scientific respectability; and continues to resist being pinned down.
I thoroughly recommend this biographical masterpiece.
A group of 6 ‘heat pump curious’ visitors, organised through our local climate group, cycled from Woodchester to Nailsworth to visit our heat pump and get their questions answered. My wife took some videos of me extemporising. It was a cold day (about 6C outside).
The house is over 200 years old, Grade 2 Listed, and with a floor area of about 250 square metres. Instead of having one large heat pump, Cotswold Energy Group, who installed the system 3 years ago, provided two smaller units. This had the benefit that for much of the year only one is running, as was the case on this visit (if, as one of the visitors pointed out, it had been -6C, then both would have been in operation).
Explaining the heat pump in plain English
So here is the first of the short videos – a plain English short talk (11 mins) explaining how a heat pump works and answering their questions.
You will notice that at one point I had to crouch down to see if one or both units was running – rather demonstrating the low level of noise they produce. At another point in the video, some of the visitors had to shuffle sideways as they were experiencing the cold air from the heat pump (which extracts heat from the air, as explained in the video). I also mention a figure of 20 litres of water a minute as the rate of flow through the radiators. This was illustrative only and not a fixed number, as it depends on a number of factors, and may have been more than that on this occasion.
Explaining why underfloor heating is not required, using a simple model
In this video (2 mins) I explained how radiators can deliver the same heat as underfloor heating, by using a simple paper model for explanation.
Everyone commented on how cosy the room was. We looked at a thermometer that showed it was at 21C. I then got someone to put their hand on the radiator and I asked if they thought it was on, and they weren’t sure. I used a thermometer gun to see how hot it was – its was only 30C. Then I got them to turn their hand palm upwards and found the temperature was 28C, and so of course the radiator didn’t feel “hot”. But, it doesn’t need to be 60C, or 70C, to heat the room, just greater than the target temperature (21C) and sufficiently higher than that to deliver the heat at the rate that balances the rate at which heat is lost from the wals etc.
The flow temperature was a bit higher than this (as this was the surface temperature of just one radiator), but it illustrates the point. ‘Low and slow’ heating works, and delivers greater comfort.
Explaining why the bills don’t need to rise going from an old boiler to a heat pump
In this video, I used simple maths to show why a heat pump shouldn’t raise electricity bills even in an old house (if properly installed), and even with our high UK electricity prices.
I slightly rushed the last part on the relative costs explanation. In the 3 bed semi example, I needed 4,000kWh of electricity say at 28p/kWh totalling £1,120/yr to run the heat pump. Assuming a 70% eff. oil gas boiler we’d would need to consume 17,143 TWh of gas to deliver 12,000 kWh of heat (as 70% of 17,143 equals 12,000). So I’d pay 17,143 kWh x 7p/kWh = £1,200 with the old gas boiler, and that is a little but more than with the heat pump.
As the ratio of the electricity unit price to the gas unit price comes down, as it assuredly will, the economic advantage of moving to a heat pump will only grow (let alone all the other ones: massive carbon emission reductions; more comfortable home; independent of petro-states for energy needs, as grid itself is increasingly dearbonised).
Postscript
The organiser of the visit, Sylvia, sent me a lovely message afterwards:
“Hi Richard, just wanted to thank you for a really interesting tour yesterday… It’s so generous of you to share your home and your experience like that, we were all impressed at how well it was working in a house like yours. Shows how much bad info there is around! You did a good job of explaining some difficult concepts too! I think we all came away inspired… Even though we may not be able to make the change at once… So many thanks from us all!”
I really enjoyed the experience too, with so many great questions.
A question came up about microbore and I gave a reasonable answer I felt, but Heat Geek provides an expert explanation of the issues and potential solutions here > https://www.heatgeek.com/what-to-do-with-microbore-pipework-on-heat-pumps/ and whether you are heat pump curious home owner, but especially a heating engineer, Heat Geek will have answers to most of your questions, and also provides training and support for those in the industry wishing to move from gas boilers into heat pumps.
It’s worth noting that NESTA provide a ‘Visit A Heat Pump’ scheme that connects those like me willing to host house visits, and those who would like to hear from someone who has a heat pump. I have hosted visits using this scheme and will do more, but its also nice to use local networks to organise visits e.g. through climate groups, churches, Rotary, or whoever.
Technical Note
For a deep dive on how radiators deliver their heat, an scientific explanation is provided in Using Radiators with Heat Pumps by Michael de Podesta.
‘Climate Models Can’t Explain What’s Happening to Earth: Global warming is moving faster than the best models can keep a handle on’ is the headline of an article in The Atlantic by Zoë Schlanger [1]
The content of the article does not justify the clickbait headline, which should instead read
‘Climate Models Haven’t Yet Explained an anomalous Global Mean Surface Temperature in 2023’.
Gavin Schmidt authored an earlier comment piece in Nature [2] with a similarly hyped up title (“can’t” is not the same as “haven’t yet”). He states very clearly in a discussion with Andy Revkin [3], that he fully expects the anomaly to be explained in due course through retrospective modelling using additional data. It’s worth noting that Zeke Hausfather (who also appears on Revkin’s discussion) said in an Carbon Brief article [4] that 2023 “is broadly in line with projections from the latest generation of climate models” and that there is “a risk of conflating shorter-term climate variability with longer-term changes – a pitfall that the climate science community has encountered before”.
It is not surprising there are anomalous changes in a single year. After all, climate change was historically considered by climate science as a discernible change in averaged weather over a 30 year period, precisely to eliminate inter-annual variability! Now, we have been pumping man-made carbon emissions into the atmosphere at such an unprecedented rate we don’t have to wait 30 years to see the signal.
If you look at the historical record of global mean surface temperature, it goes up and down for a lot of reasons. A lot of it has to do with the heat churning through the oceans, sometimes burping some heat out, sometimes swallowing some, but not creating additional heat. So the trend line is clearly rising and the models are excellent in modelling the trend line. The variations are superimposed on a rising trend. Nothing to see here, at this level of discussion.
The climate scientists are also, usually, pretty good at anticipating the ups and down that come from El Nino, La Nina, Volcanic eruptions, etc. (Gavin Schmidt and others do annual ‘forecasts’ of the expected variability based on this knowledge). Which triggered the concern at not seeing 2023 coming, but why expect to get it right 100% of the time?
Don’t confuse this area of investigation with extreme weather attribution, which addresses regional (ie. sub-global) and time limited (less than a year) extreme events. Weather is not climate, but climate influences weather. So it is possible using a combination of historic weather data and climate models to put a number on the probability of an extreme event and compare it with how probable it has been in the past. So, 100 year events can become 10 year events, for example. This is what the World Weather Attribution service provides. The rarer the event, the greater the uncertainties (because of less historic data to work with), but it is clear that in many cases extreme weather events are becoming more frequent in our warming world, which is no surprise at all, based purely on statistical reasoning (The Royal Statistical Society explain here.)
So back to The Atlantic piece.
The issue I feel is that journalists and lay people can’t abide uncertainty. What are the scientists not telling us! In general people want certainty and often they will choose based mostly on their own values and biases rather than expert judgment. In the case of the 2023 anomaly, the choice seems to be between “it’s certainly much worse than the modellers can model”, “it’s certainly catastrophic”, “it’s certainly ok, nothing to see here”, or something else. All without defining “it’s” or providing any margin of error on “certainty”. Whereas scientists have to navigate uncertainty every day.
The fact is that we know a lot but not everything. There is a spectrum between complete certainty and complete ignorance. On this spectrum, we know:
a lot ‘that is established beyond any doubt’ (e.g. increasing carbon dioxide emissions will increase global mean surface temperatures);
other things that ‘are established outcomes, but currently with uncertainties as to how much and how fast’ (e.g. sea-level rise as a result of global warming and melting of ice sheets, that will continue long after we get to net zero; before it reaches some yet to be determined new equilibrium/ level);
and others that ‘currently, have huge uncertainties attached to them’ (e.g. the net amount of carbon in the biosphere that will be released into the atmosphere through a combination of a warming planet, agriculture and other changes – we don’t even know for sure if it’s net positive or negative by 2050 at this stage given the uncertainties in negative and positive contributions).
So we can explain a lot about what’s happening to Earth, we just have to accept that there are areas which have significant uncertainties attached to them currently, and in some cases maybe forever. Not knowing some things is not the same as knowing nothing, and not the same as not being able to refine our approaches either to reduce the levels of uncertainty, or to find ways to address those uncertainties (e.g. through adaptation) to mitigate their impacts. Don’t put it all on climate models to do all the lifting here.
The current climate projections are much more precise than say the projections on stock market prices in 5 or 10 years, but we don’t use the latter as angst ridden debate about the unpredictability of the markets. We consider the risks and take action. On climate, we have enough data to make decisions in many areas (e.g. when it would be prudent to build a new, larger Thames Barrage), by using a hybrid form of decision making within which the climate models are just one input. Even at the prosaic level of our dwellings, we manage risk. I didn’t wait for certainty as to when the old gas boiler would pack up before we installed a super efficient heat pump – no, we did it prudently well beforehand – to avoid the risk of being forced into a bad decision (getting a new gas boiler). We managed the risks.
Climate models have been evolving to include more aspects of the Earth System and how these are coupled together and to enhance the granularity of the modelling (see Resources), but there is no suggestion that there is some missing process that is required to explain the 2023 uptick but probably missing data; not the same thing. Although there is a side commentary in [4] involving input from Professor Tim Palmer calling for ‘exa-scale’ computing, but Gavin Schmidt pushes back on the cost-effectiveness of such a path; there are many questions we must address and can with current models.
There are always uncertainties based on a whole range of factors (both model generated ones, and socio-economic inputs e.g. how fast will we stop burning fossil fuels in our homes and cars; that’s a model input not a model design issue). There is possibly nothing to see here (in 2023 anomaly), but it could be something significant. It certainly doesn’t quite justify the hyperbole of the The Atlantic’s headline.
If we globally are waiting for ‘certainty’ before we are prepared to act with urgency, we are completely misunderstanding how we should be managing the risks of man-made global warming.
We certainly should not, at this stage at least, be regarding what happened in 2023 as an extra spur to action. Don’t blame climate models for not having raised a red flag before or urgently enough – which is the subtext of the angst over 2023.
The climate scientists will investigate and no doubt tell us why 2023 was anomalous – merely statistical variability or something else – in due course. It is not really a topic where the public has even the slightest ability to contribute meaningfully to resolving the question. It might be better if instead The Atlantic was publishing pieces addressing the issue of what questions climate models should be addressing (e.g. constrasting the building of sea walls, managed retreat and other responses to sea level rise), where everyone can and should have a voice (as Erica Thompson discusses in her book [5]).
Climate scientists have been issuing the warning memo for decades, at least since the 1979 Charney Report, with broadly the same message. We read the memo, but then failed to act with anything like the urgency and agency required. Don’t blame them or their models for the lack of action. Ok, so the advance of models has allowed more diverse questions to be addressed (e.g. trends in flooding risks), but the core message remains essentially the same.
And please, don’t use 2023 as another pearl clutching moment for another ‘debate’ about how terrible things are, and how we need more research to enable us to take action; but then turn our heads away again. Until the next headline, of course.
(c) Richard W. Erskine, 2025
REFERENCES
‘Climate Models Can’t Explain What’s Happening to Earth: Global warming is moving faster than the best models can keep a handle on’, Zoë Schlanger, 6th January 2025, The Atlantic.
ANDY REVKIN speaks with longtime NASA climate scientist GAVIN SCHMIDT about his Nature commentary on what missing factors may be behind 2023’s shocking ocean and atmosphere temperature spikes, Youtube, https://www.youtube.com/live/AYknM2qtRp4?si=fsq0y-XkYG58ITw5
‘Escape from Model Land: How mathematical models can lead us astray and what we can do about it’, Erica Thompson, 2022, Basic Books.
I have written a while ago about the project to replace a 25 year old creaking gas boiler with an Air Source Heat Pump. Today we had our annual service provided by Cotswold Energy Group, the original installer. All clear for another year.
The main advice we follow is not to fiddle with the as-installed setup at all – we let it do its thing! We don’t even adjust the controls (TRVs) on radiators because the system was well ‘balanced’ as part of the commissioning of the system. The only thing I look at periodically is the performance data via my phone or PC. If there was some malfunction it would no doubt show up in a drop in weekly performance data. Mostly we forget the system is there.
So I thought I’d just provide a summary of the 2024 performance and running costs.
Summary
A recap. Our house is a large semi-detached dwelling with a total floor area of 251 m² over three floors. It has solid walls [1], and mostly sash single glazed windows. Only the loft insulation and brushes on sash windows are additional retrofit ‘fabric’ measures [2].
The total heat delivered to the house over the last 12 months (directly metered from pipes flow and return gauges) was 29,236 kWh (kilowatthours), and that was achieved with the input of 7,942 kWh of electricity (again, using dedicated metering). So the annual performance (the so called Seasonal Coefficient Of Performance, Seasonal COP or SCOP) is found by dividing the first number by the second, giving a SCOP of 3.68 for 2024. That can be thought of as an efficiency (output divided by input) of 368%. This apparently magical feat (obtaining an efficiency of greater than 100%) is achieved because the heat pump harvests energy from the ambient environment (in our case, the air), and concentrates it to raise its temperature.
Looking at data on a monthly basis, I found that the worst month was January with a COP of 3.06. There will be days when it was worse than this but even on a daily basis it rarely drops below 2.5; for just a handful of days in the year.
If we’d stuck with our old boiler which optimistically ran at 72% efficiency [3], then the primary energy required (in form of gas) would be equivalent to 40,606 kWh (that is 29,236 divided by 0.72).
The result of this is that we are saving about £480 a year as a result of ditching the old boiler, and also achieved a more comfortable evenly heated home (rather than the roller-coaster heating we had with the gas boiler).
With the old system, hot water to our shower came via a gravity fed system and needed a little pump to improve the pressure (noisy, and pressure not that great). With the heat pump and new water tank we now get our hot water under mains pressure. This was one of the most surprising benefits of our move to a heat pump system.
Running cost comparisons
Taking the unit prices for gas and electricity that applied for us for the most of 2024 (5.9p/kWh and 22.7p/kWh, respectively), and the standing charges (28.21p/day and 58.63p/day, respectively), the cost of heating (mainly space heat, but some water heat too) was £2,017 in 2024.
Had we stayed with our old gas boiler, it would have been about £2,500 to do the same job. Probably more because the system was creaking and unlikely to have performed according to the published performance figures [3].
Conclusion
Yes, you can heat any old building with a heat pump without having to make any significant or disruptive changes to the insulation.
Of course, where you can add insulation to a house heated by a gas boiler you can reduce the rate of heat loss and therefore the heating bills. The same is true of heating with a heat pump. But you will find that as you try to reduce the heat loss further and further, the costs will escalate, as I discussed in Insulate Britain: Yes, But by How Much?.
No, it wasn’t difficult to install (whatever ‘noises off’ you may hear from the perenially sceptical ‘You & Yours’ [4], and other naysayers), if you engage professionals with the experience, as you would do for any important job.
We remain very happy with our Air Source Heat Pump and our suppliers. We have a more comfortable house, that is cheaper to run than the boiler it replaced (even given the unjustifiable ratio of electricity/gas unit costs), is very reliable, and we have better showers.
No fiddling, or ‘intelligent home’ tech, required. Keeping it simple.
What’s not to like. You won’t regret it.
(c) Richard W. Erskine, 2025
NOTES
[1] The 200 year old walls are termed ‘solid’, but are actually two course of Cotswold stone with in-filled rubble, providing an element of air gap. The overall wall thickness at ground level is about 600mm. This kind of wall tends to perform better than is often assumed.
[2] I get a little frustrated with the question “is your home insulated?” If one lives in an imaginary house with no roof or walls then the answer would be no! The fact is that any structure that is enclosed provides insulation. The question is really shorthand for “has any insulation been added to the fabric of the building above and beyond the original construction?”. Most people now have some form of loft insulation which wasn’t original, but it is worth ensuring you have it up to the recommended depth (but going much beyond that is not really needed as there is a law of diminishing returns). Draught-proofing is a really good idea, as it reduces the air turnover in the house, improves comfort levels near windows and doors, and is relatively inexpensive. Extraction fans in kitchens and bathrooms are also important, both in reducing the risk of mould, but also because moist are needs more energy to warm it!
[3] You can find out the estimated efficiency of your old boiler using the Product Characteristics Database search function. Our old boiler was a Glow-worm Hideaway 120B. I’ve taken the slightly higher figure presented for winter of 72% (rounded), even though this is likely to be optimistic for a 25 year old boiler.
[4] ‘You & Yours’ is BBC Radio 4’s consumer affairs programme https://www.bbc.co.uk/programmes/b006qps9 – Today (6th Jan 2025), during a segment about heat pumps we heard about the forthcoming new homes standard, and research being done with Barretts and Salford University. I was astonished to hear that with their new build standards they were seeing a performance, for the air-source heat pumps used to heat the new home (they were referring to the SCOP), of 3. That’s right, worse than our 200 year old house! For new homes, I would suggest a SCOP of 4 is an absolute minimum target, and I’m sure that those clever chaps at Heat Geek would be aiming for 5.
The researchers also “discovered” that the efficiency of heat pumps improves if they are kept on rather than used like gas boilers (being put on on the morning for a few hours and then again in the afternoon). Who knew? Anyone who has any knowledge or expertise in heat pumps, that’s who. With our house, the thermostat in the living room is set to 21C from 0630-2230 and setback to 18C from 2230-0630. The heat pump works only as hard as it needs to (based on the external temperature) to achieve this goal, and does this by changing the ‘flow temperature’ as needed. In our system the maximum design flow temperature of 50C is only for the very coldest days (perhaps a few days a year). In my house over the last month it has averaged about 35C and only once gone above 40C (a few days ago it was 42C).
It then discussed the use of radiant heating for those small dwelling “unsuitable” for a heat pump! I know that Nathan Gambling of BetaTalk would probably be jumping up and down at this point! The Air to Air kind of Air-Source Heat Pumps can be quite compact systems, and can be fitted to any dwelling. For a small flat, at a lower cost than a gas boiler. Direct electric heating may have a niche role is super-efficient PassivHaus’s, we’ll see, but it is not true to claim that heat pumps cannot be used in small dwelling.
So I haven’t a clue about the quality of the research referred to, but based on this admittedly brief segment, it did raise some concerns as to the research brief. And it is clear that the producers and lead presenter on You & Yours are still unable to accept that heat pumps are the primary game in town, so they will continue to find ways to sow doubts.
Today, World Environment Day, the UN Secretary-General António Guterres made a special address on climate action “A Moment of Truth” in New York. In a speech that covered the impacts already being felt from the delays in taking action, and the injustices this gives rise to, he turned his ire on fossil fuel companies and their enablers (my emphasis):
“Fourth and finally, we must directly confront those in the fossil fuel industry who have shown relentless zeal for obstructing progress – over decades. Billions of dollars have been thrown at distorting the truth, deceiving the public, and sowing doubt. I thank the academics and the activists, the journalists and the whistleblowers, who have exposed those tactics – often at great personal and professional risk. I call on leaders in the fossil fuel industry to understand that if you are not in the fast lane to clean energy transformation, you are driving your business into a dead end – and taking us all with you. Last year, the oil and gas industry invested a measly 2.5 percent of its total capital spending on clean energy.”
He then went on to say:
“Many in the fossil fuel industry have shamelessly greenwashed, even as they have sought to delay climate action – with lobbying, legal threats, and massive ad campaigns. They have been aided and abetted by advertising and PR companies – Mad Men – remember the TV series – fuelling the madness. I call on these companies to stop acting as enablers to planetary destruction. Stop taking on new fossil fuel clients, from today, and set out plans to drop your existing ones. Fossil fuels are not only poisoning our planet – they’re toxic for your brand. Your sector is full of creative minds who are already mobilising around this cause. They are gravitating towards companies that are fighting for our planet – not trashing it. I also call on countries to act. Many governments restrict or prohibit advertising for products that harm human health – like tobacco. Some are now doing the same with fossil fuels. I urge every country to ban advertising from fossil fuel companies. And I urge news media and tech companies to stop taking fossil fuel advertising.”
The on-going activities of organisations, individuals and PR companies funded by fossil fuel interests did not end in the mid 1990s (even <shocked emoji> in the UK), and has continued in many ways unabated, as Desmog has documented on an almost daily basis https://www.desmog.com. However, now the emphasis is on trying to undermine climate solutions, so as to justify carrying on using fossil fuels, either in electricity generation, or in end-use such as transport and heating. But as the alternatives are now so good, the PR and greenwashing has to be world-class to try to undermine them.
So it was astounding to hear Nick Butler – a Visiting Professor at King’s College – being interviewed on BBC Radio 4’s PM today (5th June 2024) by Evan Davis, being highly critical of the Secretary General’s speech. When asked about fossil fuel companies obstructing public discourse with their lobbying, public affairs, and so on, he said:
“… I think that was the case in the past but from the middle of the 1990s that has changed, certainly for the European companies, certainly BP and Shell, are going in a different direction …” <my jaw drops emoji>
Well being an ex-BP employee he would say that wouldn’t he. He is just one example of what might be called an apologist for climate greenwashing.
And it is incredibly disingenuous to say that adverts for oil and gas don’t appear on TV anymore in the UK. No, but adverts and PR for petrol powered SUVs, or Hydrogen Boilers, or … the list goes on. And to say that its all our fault for making the wrong choices, as Nick Butler suggested, is really the equivalent of victim blaming. I can’t take an EV Bus if there are no EV Buses (or indeed no bus service worth talking about), because car manufacturers and fossil fuel interests have been in cohoots to promote gas guzzlers (and are now whining because the China actually invested in an EV supply chain and market).
The truth is that between 2010 and 2018, Shell dedicated just 1% of its long terms investments to renewable energy, and paying creative agencies to target influencers to improve the brand’s image, etc, as Client Earth’s expose ‘The Greenwashing Files’ reveals. BP and the rest are no different.
You see they have moved on from the mid-1990s. Then the focus was on full front climate science denial, through a myriad of think tanks, influencers writing for the Daily Telegraph, Wall Street Journal, and wherever. Now they are more subtle, more devious. “Oh yes we love renewables”, they will say, but “when the wind doesn’t blow or it doesn’t shine our gas will be needed to generate your electricity”. Gas, I should stress, which they want to grow as a proportion of their business, not phase it out at all. It’s almost as if they are trying to gaslight renewables.
We have an example in the UK of fossil fuel interests – the gas network – producing hit pieces on heat pumps, and claiming that green hydrogen is better, even though all the science shows this is not the case (and in any case, its a ruse by them to carry on extracting natural gas to turn into hydrogen, which will never be green, because they will never be able to afford to bury the carbon dioxide produced in the process). Yet even the Bosch executive vice-president Stefan Thiel now accepts that hydrogen is a lost cause for heating homes. The delays caused by the industry’s disinformation campaign on just this one attack line has come at a cost – being delays in decarbonising UK home heating.
And the greenwashing has been getting worse as the fossil fuel companies try desperately not to be in possession of stranded fossil fuel assets. But they, and their PR / Advertising agencies, are now feeling the heat as one Desmog story Litigation Over Misleading Climate Claims Has ‘Exploded’ Over the Past Few Years reveals:
“Companies are increasingly facing legal action over their false or misleading climate communications, according to a new report examining trends in global climate litigation. That report, released late last week, highlighted a surge in litigation around climate-related greenwashing — what researchers have termed “climate-washing” — over the past few years.”
And to take Shell as an exemplar again, far from “going in a different direction”, as Nick Butler claimed, they are actually reducing investments in renewables because it does not “align” with their strategy to maximise extraction of methane (aka “natural” gas, see what they did there, long ago). They have been pulled up several times for misleading greenwashing advertisements.
As recently as 2022 Shell has had some of its adverts banned by the Advertising Standards Authority (ASA) for misleading claims about how clean its overall energy production is, as the BBC reported here.
One can forgive Evan Davis for not being as well briefed as he could be on the history and on-going tactics of the fossil fuel companies to delay the green transition through well funded PR, advertising and influencer campaigns, but it would not be a bad idea for BBC PM to do a follow-up with someone who is well informed.
For example, how about inviting Joana Setzer (Associate Professorial Research Fellow at the Grantham Research Institute on Climate Change and the Environment), and co-author of the report Global trends in climate change litigation: 2023 snapshot, as we know how much the BBC loves a bit of balance.
I was prompted to write this essay after listening to Justin Webb interviewing Ernest Scheyder (author of The War Below: lithium, Copper, and The Global Battle To Power Our Lives) on BBC Radio 4 Today on 3rd April 2024. I was impressed by the author’s arguments, stressing the need to make informed choices in the way we mine for minerals. I was however rather depressed by Justin Webb repeating talking points that are used by those trying to halt or delay the transition to clean energy. One thing Webb said rather illustrates my point:
“Is it also the case of us of us thinking whether we can find some other way of powering ourselves in the future that doesn’t involve doing this, because I wonder if that’s what some people at least listening to this are thinking, just going from taking one out of the ground – oil – into taking another thing or another set of things just isn’t the answer, isn’t the long-term answer for the planet.”
The false equivalence between the extraction of fossil fuels and the extraction of minerals used in renewable technologies is so great (by a factor of between 100 and 1000), philosophers might call it a ‘category error’. I’ll get into the details below, but first I want to address the general issue of harms.
A reduction of harms
Imagine it is the 19th Century and it is proposed that workmen use poles with brushes to sweep chimneys in order to replace children going up chimneys. This is motivated by a need for a reduction in harms to children.
What would you think if someone said that chimney sweeps will harm birds nesting in chimneys and so we shouldn’t rush to replace children? A ridiculous argument, you may think, because it highlights the lesser harm without mentioning the greater harm that is being eliminated.
But that is effectively how many argue against renewable technologies aimed at displacing fossil fuels.
I call it the ‘Fallacy of Perfection’: the idea that any new solution should be developed to a point where it has no discernible short-comings before it can be scaled up to replace the old ways of doing things.
Perhaps the most popular and persistent of the myths relate to the mining of minerals needed for EVs and other renewable technologies. Like a meme that now floods social media, we hear that EVs are not green because of this or that, and the implication being we must find an alternative, or do nothing (which would please the fossil fuel companies – the planet, not so much). The naysayers are delaying getting to net zero which is time critical; it’s almost as if they do not take seriously the increasing impacts of man-made global warming!
The Carbon Brief Factsheet included the following graph:
The harms done by fossil fuel extraction and use is the main cause of the climate and ecological crisis we face.
EVs by contrast are like the birds nests being disrupted by a chimney sweep. There are issues to be resolved – and can be relatively easily – but using these issues as a reason to slow the displacement of fossil fuel use is a dangerous argument, that gives succour to those in climate denial.
The impacts from global warming gets worse in proportion to the cumulative emissions of greenhouse gases, most crucially carbon emissions from burning fossil fuels. Delaying getting to the point where we stop burning fossil fuels will only increase the harms that global warming is already causing. These will get worse with each year we keep emitting on the scale we are at present.
In this world, nothing comes with zero impact, and yes, mining for minerals needed for renewables comes with impacts, but we can choose to mitigate those impacts. But let’s get one thing clear, there is no shortage of the minerals we need to get to net zero. We do need to make choices on where we mine, and also the controls we put in place to minimise impacts, both ecological and social, as Ernest Scheyder makes clear. But we do not have the option not to mine at all, if we are serious about mitigating global warming!
But claiming EVs are uniquely problematic ignores the reality of the immediate impacts – such as from the huge spills of oil (Deepwater Horizon disaster for example) or the water pollution from tar sands, and much more – let alone the longer term ones.
People will need to travel in 2050, and whether it be on bikes, trains, trams, buses or cars, they are going to be mostly EVs (not Hydrogen Cell vehicles). So we need to use our ingenuity to electrify transport, and do it in the fairest way possible.
So let’s not use the fallacy of perfection as a reason for not rapidly decarbonising transport, that the World Bank has called the ‘low hanging fruit’ of decarbonisation.
Immediate impacts of fossil fuel mining
Fossil fuel extraction has immediate impacts that far outweigh the impacts from mineral extraction, in part because of their scale, as with the devastation caused by the Deepwater Horizon, or the pollution of the Niger delta, or the water issues cause by the Canadian Tar Sands mining, impacting people’s habitats and livelihoods, and the ecology.
Long-term impacts of mining fossil fuels
Fossil fuels are extracted and burned once, but the carbon dioxide they release continues to cause warming of the planet for centuries. To power a fossil fuel economy you MUST keep extracting, and do so until you have exhausted all of that ancient carbon. You cannot reuse the coal, oil or gas once it is burned.
Long-term benefits of minerals for renewables
By contrast, minerals for renewable technologies are just the opposite. They are mined one, but are continuously used, enabling three things:
Firstly, they enable us to use the energy of the sun to generate electricity to travel, heat our homes and much more.
Secondly, these technologies ensure we avoid the emissions we would otherwise make, and do this not once, but for the lifetime EV, heat pump or other end-use.
Thirdly, we can then recycle the minerals. So, we have to keep extracting minerals till we have displaced all of the fossil fuel end-use, but once we have (and when recycling is more cost-effective or regulated to be so) we won’t need further mining. We get to a circular economy, because we’ll have enough in the system to reach a steady state of circularity.
We won’t run out of minerals
There is no shortage of the minerals we need to reach a global 2050 ‘net zero’ target. A detailed full life-cycle analysis of demand for minerals shows we can decarbonise our energy production and end-use without optimistic assumptions or modal changes in, for example, transport.
Yes, we have become too dependent on China, but the Earth’s crust provides more than enough.
We can clean up the supply chains
Yes there are some sources that have a poor environmental and ethical record. The solution is not to abandon a push to electrify transport. The solution is to clean up the supply chains. This can be done in a few ways. Governments can legislate to require better management and monitoring of supply chains; consumers can choose EVs where the manufacturer is showing commitment to cleaning up the supply chain; and manufacturers themselves may simply make the moves necessary themselves. Tesla has done this (see their Impact Report), where they show they are committed to ensuring child and forced labour are not involved in materials they import.
Final thoughts
One has to wonder what are the underlying motivations, beliefs or biases that allow people to so easily pick up and repeat the myths and poor arguments that surround minerals and renewable technologies such as EVs.
Obviously, for the professional climate change deniers, they do it (whether they believe it or not) because they get well paid to write their odious pieces for The Teleggraph, Daily Mail and Wall Street Journal.
What is more puzzling is how often these memes are popular with those who would describe themselves as ‘green’. This is a conundrum that really needs a separate essay, but I think that at its root is a belief that ‘natural solutions’ and changes in society can deliver a greener future free from fossil fuels, with only minimal need to rely on that horrible technological stuff.
This is a fantasy, even while natural solutions do have an important role to play, particularly in restoring nature.
Sometimes this belief is defended using some dodgy discredited ‘science’ about the potential impact of regenerative farming in terms of improved soil carbon sequestration (something I have touched on before in Fantasy Maths and the National Farmers Union).
However in most cases I think it is a lack of appreciation of the urgency to stop burning fossil fuels, and the need to electrify much if not most of our energy end use as soon as possible, powered by renewable electricity generation.
All of us who strive to be green really do have to learn to love the technology, even while we insist on it being deployed in ways that do not perpetuate current injustices, and metaphorically and literally redistribute power.
This article includes a video and almost verbatim text of a 40+ minute public talk at Sawyer Hall, Nailsworth, on Thursday 22nd February given by Dr Richard Erskine, Education Lead for Nailsworth Climate Action Network. The numbered paragraphs refer to the slides, but only some of the illustrations from the slides are included in the text below. It’s better to play the video to see the slides alongside hearing the words.At the end of this piece are Acknowledgement, References, and some Questions and Answers from the event.
Update 13 March 2024: Report from the House of Lords on Long-duration Energy Storage: Get On With It underlines importance of storage to get us to fully clean energy system, dominated by renewables, as the talk sets out.
Update 16 April 2023: A great new blog Is a 100% Renewable Energy Grid Possible? by scientist Michael de Podesta also comes to the conclusion that 100% renewables can be achieved.
A recorded online version of the talk can be found here:
The almost verbatim script follows:
1 Greening Our Energy: How Soon
Thank you for coming in this presentation. I really want to help you to understand the potential for solar and wind to get us off oil and gas and fossil fuels in general. You’ll no doubt know – if you’ve looked in the paper or on social media – that there’s lots of opinions flying around about what’s possible and you often see numbers being thrown around. I think it’s very easy to feel bamboozled by some of the big numbers that are thrown around and statements made.
Can you put your hands up if you feel a little bit bamboozled sometimes by what you read? I’ll put my hand up as well.
2 Net Zero by 2050?
Well that’s understandablebut the interesting thing is that when we look at a recent survey [1], eight out of 10 Britains were concerned about climate change, and over half of them (52%) thought that the net zero target for 2050 should be brought forward.
3 Questions we aim to address
I want to try to address three questions in this talk:
Firstly, could all of future energy demand be met by wind and solar? now that’s not to discount other forms of low carbon energy, but if we can show that it can be done with wind and solar, then of course, any other forms of low carbon or zero carbon energy that are available will simply make that goal easier to meet it won’t make it harder to meet.
Specifically, nuclear has met about 20% of our generation needs over recent decades, and it is likely with new projects to continue to do so, and given the climate crisis it would be foolish to stop this, but I want to focus here on wind and solar.
Secondly, what are the opportunities and hurdles on this journey, and
Thirdly, how soon can we do it?
4 My Journey
We are all on a journey.
My journey on these questions started with David Mackay’s famous book ‘Sustainability Energy without the hot air’ [2] which was very influential. It was forensic in working out the carbon intensity of everything we own or do, and in looking at the possible ways to get off fossil fuels.
I later attended the course Zero Carbon Britain (ZCB) at the Centre for Alternative Technology (CAT) [3]in Machynlleth, and this inspired me to believe that we could actually do it.
5 New look at Mackay’s UK numbers
The David Mackay analysis was brilliant but it suggested that we would struggle to get to 100% renewables because the one thing Brits are all good at is saying: “NO!”. No to this solar farm; no to those new pylons; and so on. He was accused of being pro nuclear because he felt we unavoidably would need plenty of it. He replied that he was only in favour of maths.
However, solar and wind costs have fallen dramatically. British opinion is now firmly in favour of renewables. This recent paper [4] – I’ll refer to it as the ‘Oxford paper’ – has revisited Mackay’s numbers and I will share their findings.
6 … and not forgetting a global view
And let’snot forget the paper [5] that made a big splash because it showed that increasing innovation could result in trillions of cost savings if the world pushed hard for renewables.
7 An over abundance
People talk about fusion power which is famously always 50 years away. But we have a fantastic fusion reactor up in the sky – it’s called the Sun! The Sun deposits 170,000 Terawatts of energy on the Earth, which is about 10,000 times more than humanity needs currently. And – wait for it – Shell pointed this out in 2005! [6]
Is anyone really saying that humanity doesn’t have the ingenuity to harvest just one 10,000th of the energy we get from the Sun? Are they really saying that we cannot use this massive over abundance of energy from the Sun?
8 How is UK doing so far?
Before looking into the near future, let’s do a check on where we are. We keep being told we have been leaders. So are we?
Yes and no.
We were certainly leaders when we passed the Climate Change Act in 2008, and when the 2050 Net Zero target was incorporated in 2019. Now look at the numbers.
9 Fossil fuel (FF) UK in 2017
The picture below from the Centre for Alternative Technology (CAT) Zero Carbon Britain (ZCB) report [3] shows that primary energy in 2017 was 80% fossil fuel [I chose CAT’s graphics in part beause they are better for clear and uncluttered communication of the information than many other source – in the talk I overlay some of their slides with key messages in text boxes].
Primary energy is the inherent energy in a lump of coal for example. But when you burn fossil fuels you lose energy in heat that doesn’t do useful work and so you lose 25% of that.
The other key point is that only 20% of delivered energy was electrified at in 2017.
10 Decline of coal in electricity
This Our World In Data graphic shows what has happened in the last 40 years. Coal in electricity generation has dropped from 60% to almost zero [7] in that period. This was a great achievement.
11 The dash for gas
But again, just looking at the electricity generation, gas generation has displaced coal [8]. A cleaner form of energy but still a fossil fuel putting carbon dioxide in the atmosphere. [8]
12 Renewables growing fast
But renewables in recent years, due to their plummeting costs, have been growing really fast over recent decades, and it’s nearing 40% of annual electricity generation. Half of this comes from wind. [9]
13 Good news, bad news 1/2
Good news, Bad news.
Whether it’s the climate change committee or the national audit office or lawyers: they’re telling the government to pull your finger out if we’re gonna to get to clean the clean grid by the middle of the next decade.
Climate Change Committee’s 2022 Progress Report showed that only 8 of 50 key indicators were on track. A pretty dismal performance by the Government.
As Victoria Seabrook of Sky News reported [10], The National Audit Office has also been damning:
“The longer it takes before government finalises its delivery plan, the greater the risk that it won’t achieve that ambition to decarbonize power by 2035, or that doing so will cost consumers more” Simon Bittlestone, National Audit Office, Director of value for money studies.
Energy bills may rise again without government plan to deliver 2035 clean power target, NAO warns – A missing plan to decarbonise Britain’s electricity network is costing households, the report warned. The NAO audit prompted calls for government to lift a de facto ban on onshore wind.
Government lawyers are warning of a risk of litigation against the Government for its laggardly performance.
14 Good news, bad news 2/2
The good news is we’ve been cleaning up the electricity that is currently in use, but we’ve been slow to electrify the large chunks of the economy that are currently not electrified. Transport and heating are the two big ones.
15 Demystifying energy
I want to spend some time demystifying energy a bit.
16 What is energy?
The great American physicist Richard Feynman said that “Energy is a very subtle concept. It is very, very difficult to get right.” [11]
There’s energy in a food bar, in a battery, and in some petrol. They seem totally different – like chalk and cheese!
For our purposes, we can say energy is any source of usable power. It comes in different forms, chemical, solar, nuclear, electrical, etc.
It can be transformed from one form to another, usually with some loss of energy in the process.
This is quite important.
17 Power vs Energy
I want to use an analogy of pouring water. This 40 watt lightbulb uses a hundred times less power to drive it than the kettle. So think of the rate of water flow from here to here as equivalent to the power that’s being used. The energy consumed is then analogous to the total amount of water poured over a certain period of time. If you go for 24 hours we will get a kilowatt hour of an hour of energy used by a 40 W lightbulb. The 3 kW kettle draws much more power – which is analogous to pouring the water much faster like this – so will get to 1 kWh of energy used much sooner (in just 20 minutes).
18 Power & Energy on UK scale
If we scale power and energy up to our UK population of 60 million or so, everything is multiplied by tens of million.
So it’s typical for the UK currently to draw on 40 million kW of power, which we call 40 gigawatts (40 GW) for short. Over a year – which is 24 x 365 hours – this amounts to 350,000 gigawatt hours, which we can call 350 terawatt hours (350) TWh for short.
Country sized power tends to be in tens of GW, whereas country sized energy per year is in hundreds of TWh.
So does that mean we simply install 40 GW of wind, or a bit more to deal with less windy days or days with more demand? Not quite!
19 ‘Capacity factors’
The nameplate power rating of a wind turbine does not reflect the fact it is not always windy. The capacity factor is an adjustment that takes account of this.
For wind in the UK, the capacity factor is 40%.
For solar, given our highish latitude, the capacity factor is 10%.
So 1 GW of offshore wind delivers 3.5 TWh of energy per year.
Whereas 1 GW of solar delivers 0.9 TWh of energy per year
So why not ignore solar for the UK?
Because in winter, wind is high and solar is low, whereas in summer, wind is low and solar is high.
Most of the time, they compensate for each other in a very effective way.
20 Demystifying efficiency
Efficiency is a really key topic when we look at how we use energy. If there are two ways of getting the same result but one uses twice as much energy, it means you’ll need twice as many resources to achieve the result.
21 What is energy efficiency?
The result we want with a lightbulb is to light up a small room. Suppose we need 400 Lumens of light to do that. Then a 40W Incandescent light bulb would do that job. But it comes with large energy losses. Only 10% or less of the electricity put in is transformed into light. So we say it has an efficiency of 10% or less. [12]
22 Less energy loss improves efficiency
With a 6W LED lightbulb we can still get the result we want – 400 Lumens of light output – but with much less loss of energy through heat loss. So the efficiency increases to typically 60%.
23 Electrification revolution
The electrification revolution is key to achieving greater efficiency, because in those areas of energy use where we burn fossil fuels, there is often huge inefficiencies.
24 Faraday invented ability to turn motion into electricity
There is an apocryphal story that Michael Faraday was asked by a politician “what use is electricity?” and he replied “What use a baby?”. That baby has been through its childhood and is now ready to enter adulthood.
The electrification revolution is really not new. Michael Faraday showed how to turn motion into electricity, and the reverse of this, to turn electricity into motion. This is what an electric drill does.
Over the two centuries since Faraday and others made their discoveries various forms of energy use have been electrified. Candles were replaced by light bulbs; Mills moved from water power to electric power; Electric washing machines and other household devices replaced muscle power – arduous manual work.
But some aspects of our lives ended up being powered by burning fossil fuels, and we turn to these now.
25 Petrol/ Diesel Cars
An internal combustion engine burns petrol/ diesel to create power at the wheel, but it loses at least 70% of the primary energy in the fuel, so a petrol/diesel car only has an efficiency of 12-30% overall [13].
26 Electric Vehicle (EV) cars
An Electric Vehicle has much lower losses to create the same forward motion, losing about 20% of the energy stored in a battery. So overall, an EV has an efficiency of 77% [13]. For those EVs that include regenerative braking, they can achieve even higher efficiency.
Great Britain currently uses the equivalent of 445 TWh from petrol and diesel road vehicles. As we’ve just calculated, if this was electric we’d need just 118 TWh. Almost 4 times less [14].
27 Gas boiler for heating
A Gas Boiler is designed to create heat, but there are still heat losses that do not go towards heating rooms or water for taps. A modern condensing boiler can have an efficiency of almost 90% (although often they are setup poorly so do not achieve this level).
So for every 1 kWh of primary energy in the gas that is put in, 0.9 kWh of heat is delivered to the house.
28 Heat pump for heating
Before I talk to this slide, who has a heat pump?
OK, just a few.
Hmmm, Who has a fridge? Looks like most or all of you. But did you know that a fridge uses a heat pump.
A heat pump is a device, invented in the 19th Century for moving heat from one place to another. For a fridge, it moves it from inside the fridge to outside of it.
For heat pumps that are used for heating, an air-source the heat pump harvests the ambient energy in the air outside the house, concentrates it, then moves it inside the house, for space heating or water heating.
Then 1 kWh of electricity is augmented by 2 kWh of thermal energy from the environment, resulting in 3 kWh of delivered heat inside the house. This is an effective efficiency – or Coefficient Of Performance (COP) – of 300% [15].
29 Heat pumps usable in any home
And contrary to received opinion, heat pumps can heat any house that a gas boiler can heat [16]. The key ingredients are a proper house survey; appropriate sizing of the system elements; and properly training technicians installing the system.
(Note: I wrote a blog that attracted a lot of attention ‘Insulate Britain: Yes but by how much?’ that provides a repost to the idea that ‘deep retrofit’ is needed before one gets a het pump)
30 Electrification is future-proofing
As David Mackay observed, electrification is future-proofing. The end users of electricity, be they light bulbs, heat pumps, cars or industry, really don’t care where the electricity comes from.
And if new forms of energy prove to be advantageous in the future, we can simply plug them into the grid.
31 How much energy will UK use in the future?
So how much will the UK use in the future?
32 Electrification reduces demand
The CAT ZCB report estimated that in a UK that has stopped burning fossil fuels, where most energy use is electrified, the energy demand would be reduced by 60%to around 700 TWh.
They included quite ambitious goals for improved public transport, but others such as the Oxford study [4] referred to earlier have come to a similar estimate without assuming major behavioural change.
33 What about new demands in 2050?
The Oxford Study conservatively doubled this figure (to 1400 TWh) to allow for new or novel demands such as generative AI [17], synthetic meats, direct carbon capture, etc.
The Royal Society [18] estimates we’d need 100 TWh of hydrogen storage.
So in total, a generous 1500 TWh of energy demand is the estimate for 2050. to meet the mainly electrified demand.
34 Is it feasible with wind and solar alone?
But is this feasible with wind and solar alone?
35 UK has best wind resources in Europe
The UK has the best wind resources in Europe [3], so we are very lucky in that regard.
It’s interesting to note that at the start of the Industrial Revolution, Britain had as much energy reserves in the form of coal, as Saudi Arabia was discovered to have in the form of oil in the 20th century [2].
Now, the UK could use its wind resources to power a new Green Industrial Revolution. How lucky we are if we are wise enough to grasp the opportunity.
36 Hornsea wind farm phases
The Hornsea wind farms [19] phases 1, 2 and 3 in the North Sea will deliver 129 TWh per year, and wind farms such as these can be constructed pretty quickly. We just need to accelerate the planning processes for additional wind farms.
Floating wind resources in the deeper waters further north will benefit from even stronger wind.
37 Plenty of space to spare
Overall, having assessed the feasible use of land and sea area, the Oxford study concluded that they could even double the 1500 TWh energy supply.
With 1500 TWh, the land and sea areas required to meet the demand are modest. As a comparator, golf courses take up 0.5% of UK land.
And we won’t run out of minerals either, as a comprehensive study has demonstrated [20].
38 Infrastructure & End-use growing – in parallel
There is a perverse argument used to question the rise of EVs – not enough charging points. Or heat pumps – not enough installers. As with every transition, the growth in a new end-use is accompanied by its twin: the growth in a new infrastructure. They are like twins, running a marathon together.
39 What what about variability in wind and solar?
The question naturally arises as to the variability of wind and solar. The extreme scenario is an anti-cyclone stuck over Britain for 2 weeks with poor wind and solar power generation.
[Note added 14-5-24: An analysis of the general requirements for storage (both in terms of energy stored and power capacity) is avaialble at Storage Lab [27] ].
40 Mismatch!
Even in less extreme, or quite normal situations, the supply might be much more than needed sometimes and less than what is needed at other times.
How would we deal with this mismatch?
There are many ways to try to address this. Over a day’s cycle, we can shift demand using a smart grid and smart tariffs. We can get more or less electricity from our European neighbours. There is scope for large degrees of flexibility in the system, to flatten the peak demand.
41 Over-build option
But over slightly longer periods, like a week, we need to do more. One way is simply to build more than we need – this is termed ‘over build’, which obviously comes at a cost, but the cost of both solar and wind have plummeted so this is clearly an option.
42 Energy storage option
Another option is to store excess energy – when it is blowing hard – and to pay it back to the grid when there is a shortfall in supply. This also comes at a cost – to build the storage systems and means for regenerating the power. The choice between over build and storage options depends in part on their relative unit costs.
For the extreme case of a persistent anticyclone, over build alone cannot fix the problem. More turbines on a windless day won’t cut it. So storage has to be at least partof the solution.
43 High wind & solar challenge
But interestingly, studies have shown [21] that the need for massive storage only gets significantly pressing when the fraction of energy from wind and solar exceeds 80% of the total energy mix (which is what this graphic by Ken Caldeira is showing).
44 Batteries will play a role for shorter term
One of the beauties of renewables is that they can exist at multiple scales – for a homeowner, for a community, for a region and for a country. Storage too can exist at these different scales, as many homes who use batteries alongside their rooftop solar PV systems can attest to.
Large battery units are already playing a role in helping to ease pressure points on electricity grids.
45 Dinorwig hydro energy storage
At a larger capacity, the Dinorwig hydro energy plant provides good scale energy storage, able to respond very fast to peaks in demand, or losses in supply [22].
It’s a strategic asset for the UK, but again, it would not be enough to deal with a long-term energy or inter-seasonal storage needs.
46 Hydrogen long-term storage
A recent Royal Society report on long term storage has concluded that hydrogen will play a key role. The hydrogen can be created using electricity when there is an excess of wind or solar, and then stored, and can be used to generate electricity using a fuel-cell to put back on the grid when we need energy back.
In East Yorkshire alone, there are 3000 potential salt cavern locations totalling 366 TWh of stored energy [18].
(Editorial Note: I should stress that hydrogen in this context is for long term storage, NOT for heating. As the Climate Change Committee has projected, heating will be mostly met by domestic heat pumps and district heating – and the district heating itself will often be community-scale heat pumps. The reason for this is the vastly greater energy efficiency of using heat pumps as compared to burning hydrogen in our homes. But this is another talk!)
47 Modelling is key to ensure feasibility
Modelling of the whole system is key, including real-world weather and demand data to test the feasibility of potential solutions, over individual months …
48 Ensuring balance during extremes
… but we must also model system behaviour over decades.
They looked at weather data over a 40 year period to seek out worst case lulls.
It is always very odd that newspaper articles or social media posts raise the issue of lulls as though it is a gotcha discovery. Unsurprisingly, scientists and engineers are not stupid and have of course included the issue of lulls in their projections.
49 Revisiting the questions 1/3
So let’s revisit the questions I raised. Yes, we could meet future demand using just wind and solar. There is an over-abundance of renewable energy and it is an effectively limitless resource.
And the Climate Change Committee broadly agrees, based on their recent report ‘Delivering a reliable decarbonised power system’ – although some of the details differ. And at least in the medium term, anticipate reliance on gas turbines with CCS as backup.
There are many permutations, as to the detailed plans for the transition, but the end-goal feasibility question is settled.
50 Revisiting the questions 2/3
The opportunities are legion:
to stop damaging the planet;
to have clean air in our homes and towns;
to stop being reliant on petro-states and volatile international energy markets;
and to create a newvibrant economy based on green energy.
The hurdles are also there:
regulations and an ossified planning regime that has slowed deployment of onshore wind, solar and grid connections.
We also need electricity market reforms.
But the biggest hurdle of all has been the lack of long-term thinking and political leadership at all levels of government.
51 Revisiting the questions 3/3
I think that ‘How soon’ is a poorly defined question:
How soon to displace the current gas generating capacity?
Or how soon to electrify the 80% of demand that is not yet electrified?
Those are two different targets.
The key ‘How Soon’ is really How soon will we have a government committed to a fully fledged plan to mobilise the economy – including the talents, skills, regulations and incentives needed – to start us on an accelerated path to net zero.
The Oxford paper’s recommendations are:
Remove barriers to new solar and wind energy capacity.
Continue to incentivise accelerated solar and wind energy investment.
Invest in storage solutions, grid upgrades and, where necessary, grid services.
52 Fast transformations not new
These photos of New York street show the change from horse drawn carriages to petrol cars in just 13 years; from 1900 to 1913.
Transitions can be very fast, if the will is there.
We just need to stop the mixed singles to the public and to industry and push on hard.
53 Final reflections – Embrace optimism
One of the lessons that’s been important for me to learn is that its possible to believe both that things are deeply worrying, but that some positive changes are in train, thanks to the work of many people.
A sustainable future is possible if we make progressive choices, for people and planet. It’s ok to be optimistic about the future, while recognising the challenges we face. Resigning oneself to catastrophe is a recipe for inaction and despair, and I for one reject that choice.
I’d recommend Hannah Ritchie’s recent book ‘Not the end of the World’ for anyone wanting a boost of positive thinking on the choices and opportunities we have to build a sustainable future for people and planet [23].
54 Final reflections – System change more than mere substitution
System change more than mere substitution
30 million EVs is not the answer to 30 million petrol and diesel cars (but how many?)
System change not merely substitution.
We need less clogged up, people friendly, walkable towns & cities
Electrification of improved bus, tram & rail services also key, alongside EV cars.
55 Final reflections – We need head, hand and heart
I’d like to close by returning to Machynlleth, and the Centre of Alternative Technology, where my journey began.
While there studying energy futures we found time to spend time with nature.
Here are two fellow students Sarah and Rosie who placed their hands on a tree for me.
A green energy transition is essential to save the planet, and create a new thriving economy and society which enjoys abundant energy enabling education, health and agricultural benefits in impoverished communities [24].
But it’s not inevitable that head, hand and heart will work together to create a fairer world.
We must therefore strive to put communities at the heart of everything we do, to decentralise power as far as possible, and not to perpetuate current injustices.
56 Thank you
Now please, can we have questions.
Please keep questions short as I will repeat each question to ensure everyone can hear the question and my response.
After Q&A, we can break up and move around, get a cuppa, and mingle. NailsworthCAN would very much like to share what we have been doing and to hear from you. We are keen to continue to tap into the talents and ideas of the community.
Richard Erskine, 2024
……………………………………………………………………………………………….
ACKNOWLEDGEMENTS
The talk includes insights from many people: Ken Caldeira [21], Richard Hellen [25], David Mackay [2], Hannah Ritchie [23] and Rupert Way [26] to name just a few.
And from many institutions: The Centre for Alternative Technology [3], Our World In Data [7-9], Oxford Univerisity (including the Smith School of Energy and the Environment), The Royal Society [18], The Schumacher Institute and the UK’s Committee on Climate Change, to name just a few.
How these insights and some materials and data have been used here – including any errors or omissions – are the sole responsibility of Dr Richard Erskine.
The figures used from reports are overlaid in the presentation with annotations using large text to highlight the key messages. Anyone wanting to see the original figures and data are directed via links to the sources.
Niele, Frank (2005), Energy: Engine of Evolution, Shell Global Solutions, 2005
In the text Frank Niele mentions a solar intercept of 170,000 TeraWatt (TW = 1000 GW). This is not the practical maximum for solar power we could harness (and Niele is not saying that, but some people might misread it that way). Due to a number of factors (we would only want to use a small area of land for solar, the efficiency of PVs, etc.) the practical limit is very much less. BUT, even allowing for this, the amount of energy is so massive that we are still left with an enormous potential, that far exceeds the 40 TW requirement. Humanity will need (in his 2050 projection) ’only’ about 1 million square km (or 0.67% of the Earth’s land area). So, in practical terms, there is no ‘functional limit’ in respect of the energy that humanity needs. The calculation backing this up is in Note 16 of my essay Demystifying Global Warming and Its Implications.
Feynman (1969), From an address “What is Science?”, presented at the fifteenth annual meeting of the National Science Teachers Association, in New York City (1966), published in The Physics Teacher, volume 7, issue 6 (1969), p. 313-320
“From 2023 to 2030, we are looking at about an 80% increase in US data center power demand, going from about 19 GW to about 35 GW,” Stephen Oliver, vice president of corporate marketing and investor relations at Navitas Semiconductor, said in an interview. Since total US demand is expected to rise to about 482 GW in 2027 (let’s assume 500 GW by 2030), the 35 GW for data centres is about 7% of the total – significant but hardly existentially large.
Rupert Way was co-author on both the key paper [4] above, and the 2022 paper [5] – which had considerable worldwide coverage – that showed the world could save trillions of dollars if it moved rapidy to scale up renewable technologies such as wind, solar and electrolysers
The answers given are broadly as given but with a little embellishment in a few cases. Some references added to help in solidifying the points made.
Will there be room for nature in this move to renewables, and recognising that the ecological crisis and climate crisis?
Yes. As I said, the ground mounted solar included in the Oxford paper would require 1% of UK land, but pasture takes up 30% and ground mounted solar can co-exist with grazing sheep for example.
There is a The Fallacy of Perfection, that requires that new solutions are perfect while ignoring the harms of the status quo. Extraction for coal alone in 2021 amounted to 7,500 tonnes, whereas“Estimates for the maximum amount of materials we’ll need annually to build low-emissions energy infrastructure top out at about 200 million metric tons, including all the cement, aluminum, steel, and even glass that needs to be produced.” – and once built, this level falls away, whereas with fossil fuels we keep on having to extract it. On land use too, renewables are better than fossil fuels if we look at the full life-cycle (extraction through to operation).
But it is also true that in UK we are not always very good at consulting on projects. We do a cursory consultation, then spend a lot of the budget, then start to raise questions on the requirements while construction is in full flight (HS2 was a case in point). Good project practice is to do a thorough consultation that truly listens to and engages with the public and articulates the impacts, costs and benefits of a new project and the status quo, then pilot and prototype to test out proposals, before then proceeding. Politicians are too often led by industrial partners wanting to push ahead without delay. We can build fast, but we do need to build the right assets in the right places for the right reasons.
Too often, there seems to be a belief that nature-based solutions are in conflict with technological ones, but the truth is we need both. For example, nature based approaches to flood alleviation (like SUDS) are needed, but in many cases, engineered ones (like the Thames Barrage) are needed as well. But on decarbonising our energy, technologies like wind, solar and electrolysers are essential, and as we have seen, they leave the great majority of available land area for nature to thrive, if we choose to use it to address the ecological crisis; it’s not renewables stopping us doing it!
With the greater degree of flexible working, particularly following COVID, and also streaming of top shows … will that help to flatten the peaks in demand?
Great thought! That sounds very plausible and I’m tempted to look into the data to see if this is indeed true. The general message is that there are lots of additional ways in which demand can be nudged to help lower peak demand.
Isn’t it a worry that so much comes from China – batteries and the minerals used in them and elsewhere? … use lots of dirty energy …
Yes and no. It’s those twins again. A lot of claims are made about a minerals crisis by the Seaver Wang paper from last year did a thorough study of this question, and concluded that we have more than enough minerals to decarbonise the world’s economies. However, we do need to diversify our supply of minerals, and not be over reliant on China, that is true. We have to manage political risk. As an example of diversifying sources, Lithium is now being mined in Cornwall. Canada can open up its reserves of minerals.
How large a role could community energy play in the energy transition?
That’s an important question. I made the point that renewables have the benefit of being possible at all scales. The more we can have renewables at local scales, the more resilient we are, and the less the risk of power being solely in the hands of centralised conglomerates. Some of the largest wind farms are owned by private companies that aren’t British. So I’d like to see a lot of community energy. How much of a town’s energy could be produced locally will vary a lot according to the location, and may also vary through the seasons. It’s not clear whether we’re in a position to put a number on it or decide what is optimal. However, a town will still need to be connected to the national grid because it isn’t always windy or sunny in a specific locality. Some assets like Dinorweg or future hydrogen storage facilities, are national assets, for everyone’s benefit. So we need to think of community energy as part of a whole system – giving and taking energy at different times.
You mentioned that there is a majority of people wanting the UK to be more ambitious, so why are some politicians thinking there are votes in delaying action?
What a great question. Hitherto there has been cross party support. In Parliament, there was almost unanimity in votes for the 2008, and the 2019 ‘net zero by 2050’ change. Unfortunately it seems it has become something that has become rather polarised – some trying to claim that there is a conflict between solving current financial issues and investing in the future. But as the 2022 Oxford paper by Rupert Way and others showed, we can actually save lots of money by accelerating the pace of transition to a green future.
Despite claims by the Government that the UK is a leader, we saw in the talk heavy criticisms from the Climate Change Committee and the National Audit Office on the lack of progress in many areas; the UK cannot rest on the laurels of displacing coal. So currently the UK has definitely lost its position of leadership. The country can earn back a position of leadership if politicians grasp the opportunity and stop using the climate as a political football. We need to get back to there being a cross party consensus at least amongst the major parties that will last till 2050, which is 5 Parliaments away.
Could we learn from what Nigeria is doing? They have micro grids and will later bring these together.
Different countries have started from different places. The UK have had large centralised generating capacity and will now need to loosen thing up a bit to accommodate a network of resources at different scales. Nigeria is in a sense doing the opposite from what you say – having lots of local capacity before bringing it all together. I’m sure we could learn from each other.
In the last 6 months you noticed a change in attitudes toward siting of renewables? I’m finding many acquaintances have.
Yes, and we are seeing communities embracing solar and wind for their mutual benefits, as the Channel 4 series The Great Climate Fight showed, it is often regressive Government rules and directives blocking communities from building what they want (such as a wind turbine on the edge of a village), with just a small minority vetoing progress.
Are there issues with using hydrogen, I’ve heard about?
We have to distinguish various uses of hydrogen. Michael Liebreich has a ‘hydrogen ladder’ showing where hydrogen sensibly can or should be used and where it shouldn’t. It cannot compete with electrification for cars and heating homes, and is now being relegated into relatively few areas. Energy storage is one of those. Another is fertiliser production. And there are also applications in industry. You mentioned Bath University research, so I’ll need to talk with you after to determine what issues you are referring to.
What about heat storage playing a role?
Heat storage is a great idea and there are most certainly cases for using it. I am not clear it can displace the need for long term storage with hydrogen, but I understand it could pay an important role. Its worth stressing that there is a lot of waste heat also around that could be exploited (such as from industry). Waste in our sewers could, when combined with a heat pump, supply heat, and of course there are many existing installations of water source heat pumps that can heat large building; Stroud District Council’s offices in Ebley is a case in point.
[since the talk, the following example from Princeton University has come to my attention. They will be using large heat pumps to extract heat from buildings in summer to keep them cool and store this underground, then use the heat pumps again in winter to use the buried heat to heat buildings in winter. They will create a huge thermal reservoir to achieve this outcome. https://www.princeton.edu/news/2021/11/09/going-deep-princeton-lays-foundation-net-zero-campus]
How are we going to convince people that we need a revolution in energy, especially when there are been conflict over the siting of some renewables such as the Arlingham solar array? There is a suggestion the UK should build 6-8GW of solar by 2030, but we need to take people with us.
We have to consult and engage hearts and minds? I don’t think is simply a case of not bribing people with lower bills. The use of Citizens Assemblies and other forms of engagement with the community will be key. People need to understand the benefits. A local village hall with rooftop solar, a heat pump, EV charging and a battery can become a place that brings local benefits and also helps to engage hearts and minds.
I love the BBC series ‘In Our Time’ (IOT), conceived by Melvyn Bragg (MB) and hosted by him for over 25 years. The more than 1000 episodes have covered innumerable topics in the arts, history, science, philosophy, politics and much more. Typically three Professors, leading experts in a field, are invited to explore the knowledge and scholarship on the topic of the week. Delightful surprises has been its hallmark covering topics as diverse as ‘Tea’, ‘The Neutron’, ‘The Illiad’ and so much more.
The life and work of scientists have been covered many times: Robert Hooke, Dorothy Hodgkin and Paul Dirac being a few examples. You might think that the most pressing topic of our age – man-made climate change – might get quite a bit of attention, but it doesn’t. It’s not as if its too contemporary for IOT’s tastes; unsuitable for the historical lens that IOT likes to employ. The science of climate change dates back at least 200 years.
The lives of five scientists come to mind which could help explore the huge subject of climate change: John Tyndall, Svant Arrhenius, Guy Callendar, Wally Broecker and Michael Mann are just a small sample of ones that come to mind. None of these has been covered by IOT. Here’s why each of these would be great candidates for an episode:
John Tyndall is regarded as one of the greatest experimentalists of the 19th century, and a great populariser of science. His apparatus – that in the years 1859-1861 demonstrated that carbon dioxide and other gases were heat trapping, but that oxygen and nitrogen were not – can still be seen at The Royal Institution, where he did his experiments. An episode could cover Tyndall or simply be on ‘Greenhouse Gases’ and include a survey of work up to Manabe & Wetheralds seminal 1967 paper.
Svante Arrhenius, a Nobel Prize-winning scientist, published the first calculation on how much the world would warm if the concentration of carbon dioxide (CO₂) in the atmosphere doubled – in 1896. Again an episode could cover Arrhenius exclusively or deal with the question of ‘Earth Climate Sensitivity’.
Guy Callendar published a paper in 1938 that was the first to demonstrate empirically the correlation between rising levels of CO₂ in the atmosphere (attributable to human activities) and rising global mean surface temperature. Some have even suggested that instead of referring to ‘The Greenhouse Effect’ we should use the term ‘The Callendar Effect’.
Wally Broecker was a famous oceanographer who coined the term ‘The Great Ocean Conveyor’, which moves heat around the oceans of the world, and whose understanding is crucial to climate science. He also coined the term ‘Global Warming’. Broecker said that following the publication of Manabe and Wetheralds seminal 1967 paper, man-made climate change stopped being a cocktail conversation amongst scientists, and something that was increasingly concerning.
Michael Mann et al published the famous ‘Hockey Stick’ paper in 1999 which gathered all the disparate data to demonstrate unequivocally that the world was warming. So powerful in fact that the fossil-fuel funded forces of denial started a vicious campaign to try to discredit Mann. They failed, as the findings have been supported by independent research since.
Needless to say, there are a wealth of women scientists whose work might be considered too recent for IOT, but is often of crucial importance. For example, Friederike Otto’s work on extreme weather attribution has been revolutionary, because now we have the ability to put a number on how much more likely a specific extreme weather event has become as a result of man-made global warming. This can be done in a matter of days rather than the year or more that used to be required for this kind of attribution study (see the World Weather Attribution site for more details). The topic of ‘Extreme weather events’ is assuredly in our time, and increasingly so!
Well, no, because this episode was exceptional in more ways than its rarity.
In every other episode of In Our Time, MB approaches the conversation much like you’d expect of a curious student, trying to learn from the expert professors who he robustly challenges, but respects. The debated points would be ones where experts have engaged in debating a point in the published literature, so disagreements are possible; say, to what extent Rosalind Franklin’s work was key to discovering the structure of DNA. What is not generally entertained on IOT are outlier comments from those who are not experts in the field.
So, the IOT Climate Change episode in 2000 was quite different. Outrageously different. MB approached the conversation not as a curious student, but sounding more like an opinionated journalist with an angle doing an interview, and boy, did he have an angle!
He had a completely different tone to normal, not of respectful enquiry. He reprised talking points that are rife within climate science denial circles, and even cited Matt Ridley (“no slouch”) a well known propagandist – a free-market fundamentalist like his father – who engages in constant attacks on climate science, and the climate solutions he wishes to undermine.
Leo Hickman noted on Twitter (3-1-2015) “Little known fact: Bragg witnessed GWPF’s Companies House docs for Lord Lawson”, so one is bound to speculate whether it was no accident that MB was channeling the GWPF (Global Warming Policy Foundation) non-science.
It’s easier to see what I mean about the episode by listening to the episode but I will use some snippets from the transcript here to illustrate what I mean (MB quotes in italics):
“With me to discuss what could be called “The new climate of fear” at the beginning of a new century is …”, from the off, it was clear that MB was not interested in obvious questions like “how have we come to an understanding of man-made global warming?”. He clearly wanted to frame it in a way that minimised any discussion of the underlying science. He wanted it to be a ‘both sides’ apparent exchange of newspaper comment pages opinion.
After George Monbiot’s first contributions, MB chips in “Now this is very much a received view, and you’ve been one of the people that have made it received by banging on, very effectively in the Guardian and in other places, I’m going to challenge this in a minute or two, but I just want to emphasise to the listeners, how apocalyptic your views are, …” – trying to undermine his guest with a charge of alarmism shocked me 24 years ago and shocks me still. The reason it is ‘received’ Melvyn is because of decades of research, thousands of scientific papers, and resulting IPCC (Intergovernmental Panel on Climate Change) reports, not Monbiot’s writings, however lucid they may be.
MB later pushes harder “Right now, you two have spent….devoted your lives to this subject and I haven’t, but nevertheless, I’ve looked at…tried to find some evidence which contradicts this block view, which seems you’ve got your evidence, but there’s other points of view , and ….’cause I’m worried about the evidence that you can know so much about what’s going to happen in 100 years time, and I’m worried about the lack of robustness …”, but never asks the question ‘please help me understand the evidence’, no he shares what he has read who knows where – in The Spectator perhaps. This might seem normal on a social media comments thread but is pretty unedifying on the normally rather good In Our Time.
MB says something that is straight from the climate science denial factory at GWPF: “Mmmm, but you…well er…I’m still worried about the evidence for this, the evidence that you….what evidence can you tell us Professor Houghton, that in the next century….’cause all this is to do with man-made pollution isn’t it? That the worry is that this is the Greenhouse Effect, it’s all to do with us emitting too much CO₂, and that sort of thing, can you give us your evidence, for the…why the accumulation of this is going to have such a devastating effect? Because people use extra CO₂ as fertiliser don’t they? To bring crops on?”
The framing, the tone, the references to denialist talking points (such as: ‘carbon dioxide being good for plants therefore must be good to have more of it’, would fail Philosophy 101, let alone the scientific demolition of it).
All of the talking points he raised have been answered innumerable times, if he bothered to do genuine background reading from experts on the subject.
There have been other episodes of IOT that have touched on climate since then, such as the ones on ‘Corals’, ‘Ice Ages’ and others, but clearly both Melvyn Bragg and the production team are staying well clear of man-made climate change after their last diabolical attempt.
What motivates MB’s climate denialism is unclear. It is certainly not independent scholarship. The history of our understanding of climate change has been set out clearly many times, such as in Weart’s book (see Notes). Yet, being a Labour Peer, the free market fundamentalism that drove Lord Lawson and continues to drive much of the funding for climate denial, is unlikely to be the reason. Maybe in some perverse way, it’s his faith that took him there – who knows? The fact is he was very poorly read and badly briefed. It has left a large black hole in an otherwise great series, In Our Time, that is surely crying out to be filled.
No doubt an episode entitled ‘Man-Made Climate Change’, or one based on the life and work of the many scientists that have done so much to reveal our understanding of it, will come back as a topic in due course. There are no shortage of topics linked to it that could also be covered (Fossil fuels, Energy transitions, Extreme weather events, Rossby waves, and many others).
Though I suspect it will not be in Melvyn Bragg’s time.
We’ll have to wait for the sad day when the great man moves on.
(c) Richard Erskine, 2024.
———————— o O o ———————–
Notes
I have not made the essay longer still by including the rebuttals to all the talking points raised by MB, but I don’t need to as others have done a great job addressing commonly shared myths. A good place to go for short non-technical responses is Katharine Hayhoe’s ‘Global Weirding’ series of short videos.
The book by Spencer Weart I mentioned is a great historical survey – starting with scientists like Fourier in the early 19th Century – and is available online: The Discovery of Global Warming.
Of course, the most up to date and rigorous evidence on the causes and impacts of climate change, and on the possible scenarios we may face in the future, is contained in the IPCC (Intergovernmental Panel on Climate Change) reports. The latest full assessment being the 6th Assessment Report.
Getting a reliable sense of what the science is telling us can be hard for non-experts, particularly on shouty social media. I always feel we should go back to the established experts. Some summaries can be useful if they do not try to selectively spin the science in a direction to support a particular framing.
Intergovernmental Panel on Climate Change (IPCC) is an international body whose work is the product of an international team of scientists from over 60 countries who give their time voluntarily to produce in depth reports. The Sixth Assessment Report (AR6) is the latest full assessment, and covers different aspects: causes, impacts, adaptation and mitigation, both globally but also from a regional perspective. One of the reasons people go to secondary sources is because of the huge size of the IPCC reports. But the IPCC provides summaries. The AR6 report comes in three parts, with summaries as follows:
Part II: Impacts, Adaptation & Vulnerability Report assesses ecosystems, biodiversity, and human communities at global and regional levels. It also reviews vulnerabilities and the capacities and limits of the natural world and human societies to adapt to climate change.An accessible summary is available as a short video: https://youtu.be/SDRxfuEvqGg A written Summary for Policymakers is available here https://www.ipcc.ch/report/ar6/wg2/downloads/report/IPCC_AR6_WGII_SummaryForPolicymakers.pdf
If IOT do decide to do a new episode on Climate Change – or more accurately, man-made climate change – they might do well to first re-read Professor Steve Jones’s 2011 report on coverage of climate change at the BBC, and its tendency of using false balance. The report recommended that the BBC coverage “takes into account the non‐contentious nature of some material and the need to avoid giving undue attention to marginal opinion” (download the document then skip to page 14 to get to the report, avoiding the self-justification by BBC senior management prefixing the report itself.)
Yes, but it only dealt with man-made climate change in the dying few minutes. Richard Corfield, when not talking over the two women scientists with him, was dismissive of the risks. He used an argument that fails Critical Thinking 101, along with Ethics 101, and more.
His gobsmacking words:
“a ‘Greenhouse Climate’ is the natural condition for the Earth. 85% of Earth history has been ‘Greenhouse’ Ummm, 70 million years ago carbon dioxide levels were 8 times what they are at the moment, which made them 2,400 parts per million. Before that they were 12 times higher. The only certainty is that climate change is a natural part of the Earth and as a species we may have been the result of climate change. We may now be altering it but anyhow we’d have to deal with it, so I think we are going to have to geo-engineer our own climate to deal with it. Nothing wrong with that.”
A logically incoherent argument. And it’s not ‘we may now be altering’, we are altering, please read the IPCC reports Richard.
To conflate tens of millions of years with Homo Sapien’s quarter of a million years of existence; or the 12,000 years where civilisation has emerged, in the stable climate we have enjoyed alongside nature since the end of the last ice age; or indeed the 200 years where man-made carbon emissions have increased CO2 levels at an unprecedently fast rate in geological terms, is crass.
The way to stop additional warming is simply to stop burning fossil fuels as soon as possible.
To simply shrug and say that the climate always changes so we’d have to have done something anyway at some point is asinine, and fails to mention that we’d have had 10s of thousands of years to deal with it, not the few decades we now have left to do something, precisely because of naysayers like Melvyn Bragg and Richard Corfield.
No wonder this disaster climate advocate Richard Corfield has been on IOT 8 times.
As I discussed in a previous essay Is 2°C a big deal?, we know that as the world warms the chance of extreme weather events will increase markedly. This essay does not revisit that established insight, but is more of a diversion, exploring simple probabilities.
Attribution studies can now routinely provide estimates of how much more probable a particular event has been made as a result of man-made global warming. The World Weather Attribution organisation provides many example.
There will be impacts on the environment, society and agriculture. Focusing on the latter, sceptics might say, “ok, the chances are increasing, but if we have a crop failure in one region, one year, we have many regions able to compensate.”
The follow up question that comes to my mind is “if I accept that point the question is then how often will we have multiple failures in a given year?”.
There can be some big surprises when one explores probabilities. Bear with me as a tease out a few insights.
A famous example of surprising odds
Imagine there is a public meeting and people arrive one to one. Assume they have random birthdays and we exclude siblings. The question is: how many people need to arrive before the chance of two of the people present having a greater than evens chance of having the same birthday?
What number do you expect? Think about it.
To answer this it’s easier to start by determining the chance for each arrival to NOT have the same birthday. The 1st arrival has 365 choices out of 365. The 2nd arrival has 364 choices out of 365 to avoid having the same birthday. The 3rd arrival has 363 choices out of 365 to avoid a clash. And so on.
So the probability for 3 arrivals not having the same birthday is (365/365) x (364/365) x (363/365) which equals 0.9918 (rounded). So the chance that at least two of these three having the same birthday must be 1 minus this, which equals 0.0092 – see Note [1]. This is pretty small; about a 1% chance.
If you keep repeating this process, surprisingly one finds we only need 23 people to arrive for the chance of two matching birthdays to be greater than even (ie. greater than 0.5). See table in Note [2].
As you can see from the table, for 10 arrivals the chance of a match is just under 1 in 10 (0.1), but then rapidly escalates.
Calculating the chance of extreme weather events without global warming
By extreme weather events I’m not talking even about the current serious flooding in the UK. I’m talking about an event that would take out the arable sector in a large area.
To make this simple and purely as an illustration, I will take the 1,400 million hectares of arable land globally and break this down into 100 blocks, each of 14 million hectares.
Since the UK has 13 million hectares of arable land, the world figure can be thought of as about 100 UKs (of arable land only).
If the chance of an extreme weather event anywhere across the world between 1900 and 1950 was on average 1 in 1000 per year, that in effect defines what level of event we mean by ‘extreme’ for this illustration.
Then, we need to ask the question: what would have been the chance of 2 extreme events occurring in any one year? What about 3?
Let’s first follow a similar but adapted method as with the birthdays.
The chance of NOT having an extreme weather event in the first block is 1 minus (1/1000), which equals 0.999.
Now, the probabilities for each block are assumed to be independent, so the chance of NOT having an extreme weather event in any one year in all blocks is 0.999 x 0.999 x … x 0.999 (with 100 factors), and this equals 0.90479. So a 90% chance of not having an extreme weather event in any of the 100 blocks.
So the chance of having at least one extreme event in any one year across the 100 blocks would be one minus this figure, so that = 1 – 0.90479 = 0.09521 = 0.1 approx, or 1 in 10, or 10%. This is not insignificant. It means that a 1 in 1000 year event will happen once every 10 years somewhere on the planet.
In the next section I’ll use the percentage form, rounded to 2 significant figures to express the odds.
We have gone from a 1 in 1000 chance of an extreme event in one block in one year, to a 1 in 10 chance of at least one extreme weather event across the 100. A simpler way to see this is the 100 x (1/1000) = 1/10.
Moving to multiple extreme event is not so simple.
The basic idea is to visualise the 100 blocks as containers, and the chance of an extreme event as a ball that can be put into a container to indicate an extreme weather event has happened there.
Then, calculating the odds becomes an exercise in counting all possible permutations.
If there were 2 events in one year, then they could be in the same block (and there are 100 ways for that to happen), or in different blocks (and the chances of that are a little more complex to calculate). In general, we need to work out the odds of how you sort X objects amongst 100 containers. We do that using something called a ‘binomial expansion’ – see Note [3] if you want to dive into the details.
We can then look at what happens when the chance of any single event changes due to global warming changes from odds on 1 in a 1000 to say 1 in a 100.
The chance of extreme weather events with global warming
To explore the impact of global warming on the change odds, I have used a progression as follows. The average chance of an extreme weather event in any one year, in any one block, was 1 in 1000 but as the world warms it might become a 1 in 100 year event, or worse a 1 in 50 year event, or worse still a 1 in 25 year event. In Note [4] there are details on calculating the odds for up to 10 events per year across the 100 blocks.
The odds for a single event are already changing. The 40C weather we had in the UK would have been virtually impossible without man-made global warming. But the purpose of this essay is not to make projections or estimates, but simply to illustrate the surprising change in odds that occurs when multiple events are involved.
Here is a summary of how the odds change in our illustrative example:
We see that in the warmest scenario (1 in 25), an extreme weather event is likely to happen every year somewhere in the world (98%), but there is a high probability (77%) of there being 3 events occurring in a single year across the world.
If we have 2 or 3 blocks in the world suffering from extreme weather events and consequent crop failures, then that starts to have a major impact on food supply, which is potentially catastrophic.
What is worrying is how the odds of multiple events can escalate quite fast.
So if you have the feeling that more than one extreme event seem to be occurring every year around the world – more frequently than they were a few decades ago – you are not wrong.
(c) Richard Erskine, 2024
————————————— o o O o o ——————————————
NOTES
These notes are only included for those that wish to check my workings. Thanks in advance for spotting any errors. If you are not interested in the details, you don’t need to read these notes.
[1] The one minus trick
If you pick a card from a normal deck of cars, the chance of pulling an ace of spades is 1 in 52. As a number that equals 0.01923, it’s probability. But there is 100% chance (a probability of 1) of pulling a card, so one can say the chance of NOT pulling the ace of spades is 1 – 0.01923 = 0.98077 (which is also what you get from the fraction 51/52).
If a probability of an outcome is difficult to calculate it can sometimes be easier to calculate the probability of not having the outcome, and then using the ‘one minus …’ trick.
So we want the chance of at least one extreme event across 100 blocks. We could try to calculate the chance for 1 event, the chance for 2, then 3, all the way up to 100. The trick is instead to calculate the probability of there being no event across all 100 blocks. Then by taking the resulting probability from one, we get the probability of at least one event occurring.
[2] A famous example of surprising odds
Table calculating the odds:
The Product is the calculated by multiplying the successive A/B values. So for 4 arrivals the Product = 1 x 0.9973 x 0.9945 x 0.9918 = 0.9836 is the probability that none have the same birthday. So the chance of at least two having the same birthday for 4 arrivals = 1 – 0.9836 = 0.0164
[3] Use of the binomial expansion
Let’s assume that the probability of a loss of crops due to an extreme weather event in any one year for any region (because of many possible direct or indirect effects: extended heat wave; flooding; inability to work outside; migration; war) is p, then:
The chance of there NOT being an extreme event in one specific region in any one year is (1-p)
The chance of there NOT being an extreme event ANYWHERE in the world (for all n blocks) in any one year is (1-p) raised to the power n, which is written (1-p)n
Therefore, the chance of there being at least one extreme event (ie. 1, or 2, or 3, etc.) anywhere in the world, in any one year is 1-(1-p)n
The probability of exactly k out of n regions being hit by an extreme weather event in any one year is trickier to calculate but can be done using the binomial expansion:
P(k,n) = ( n!/ (k!(n-k)! ) * pk * (1-p)n-k
To create a table it is convenient to use a generator (especially if n gets very large, as some spreadsheets will blow up or truncate numbers in an unhelpful way), so, we start with P(1,n):
P(1,n) = n * p * (1-p)n-1
P(2,n) = ((n * (n-1)) / 2) * p2 * (1-p)n-2
and in general there is the way to calculate the next number based on the previous one:
P(m+1,n) = P(m,n) * ((n-m)/(m+1)) * p / (1-p)
This is the formula used in the Table (see Note [4]) for P(2,100), P(3,100), etc.
eg.
P (2,n) = P(1,n) * ((n-1)/(2) * p / (1-p)
The sum of P(i,n) from i = 0 to n must be 1
For n=100, the chance of at least 1 event would be P(1,100) + P(2,100) + … + P(100,100).
The chance of at least 2 events would be P(2,100) + P(3,100) + … + P(100,100).
And so on.
[4] Table of probabilities based on binomial expansion
How do people respond to ‘signals’ regarding their health and well-being?
Some people will refuse to respond, such as these smokers I saw outside a hospital a few days ago (where I was visiting my daughter, thankfully now discharged after a nasty infection; not coronavirus).
There is a large sign ‘Strictly No Smoking’, that is routinely ignored.
And what of people who read Richard Littlejohn and others, for years in the Daily Mail, Daily Telegraph, The Spectator, etc., railing against the ‘nanny state’ or ‘elf and safety’ ?
Large swathes of people are effectively inoculated against alarm, and will not respond to signals, even if a megaphone was put to their ear.
These are the super-spreaders of denial and complacency.
I am not talking here of professional dissemblers in the climate realm who make their living trying to undermine the scientific consensus. Those who write opinion pieces claiming, wrongly:
more CO2 is good for us because plants will flourish (Matt Ridley);
or claiming ocean acidification is non-existent (James Delingpole);
or that it’s the sun’s fault (Piers Corbyn);
or that we are about to enter an ice age (Daily Mail and Daily Telegraph every 6 months for the last 10 years) .
Like stories of Lord Lucan sightings, these lazy opinion formers simply dust off the old rubbish to serve it up again, and again. Year in year out. It pays the mortgage I suppose. And when they tell people what they want to hear – that we can carry on regardless – there is no shortage of chortling readers. Ha ha ha. How very funny, poking fun at the experts.
No, I am not talking about these dissemblers, but rather, the mass of those who have been reading this rubbish for 30 years and are now impervious to evidence and scornful of experts.
And there is an epidemic of such people, who believe
no need to be alarmed, staying calm and carrying on regardless
It is not just health or climate change, but is applied universally. For example, the Millennium Bug was apparently overblown according to these people (having seen the code that needed fixing, I can assure you, it wasn’t).
However, those who deal with addressing threats are in a no-win situation: if they act and prevent the worst happening, then people – who are largely unaware of what is being done behind the scenes – will say ‘you see, it wasn’t a problem’. If they didn’t act, then guess who would get the blame.
Yet when people do raise the alarm, such as when parents wrote letters complaining of the risks of the vast colliery tip adjacent to the Welsh town of Aberfan, they are often brushed off, and the result was a disaster that lives on in our memory (see Note).
Now we have the Covid-19 virus.
It is no surprise that there have been many saying that people are being unnecessarily alarmed; and the message is the same – we should ‘Keep Calm and Carry On’.
It’s just like seasonal flu, don’t worry. It will disappear soon enough.
These are often the same people who rail against ‘climate alarmism’.
Man-made global heating will be orders of magnitude worse than Covid-19, across every aspect of society – food security, sea-level rise, eco-system collapse, mass migration, heat stress, etc. – and over a longer timescale but with increasing frequency of episodic shocks, of increasing intensity.
Unlike Covid-19, there will be no herd immunity to climate change.
But we have the ability to halt its worst impacts, if we act with urgency.
We cannot quarantine the super-spreaders of denial and complacency, but we can confront them and reject their message.
I wonder, as the mood seems to be changing, and experts are now back in fashion it seems, could this be a turning point for action on climate change?
Can we all now listen to the experts on climate change?
Can we Keep Calm, but Take Action?
(c) Richard W. Erskine, 2020
Note
There was a collapse of part of the massive colliery spoil tip at 0915 on 21st October 1966The main building hit was Pantglas Junior School, where lessons had just begun. Five teachers and 109 children were killed in the school.
As one example of numerous correspondence prior to this, raising concerns, was a petition from parents of children at The Grove school raising the issue of flooding undermining the tip. This was passed up through the bureaucracy, but a combination of the Borough Council and National Coal Board failed to act. As the official report noted in unusually strong words:
“As we shall hereafter see to make clear, our strong and unanimous view is that the Aberfan disaster could and should have been prevented. … the Report which follows tells not of wickedness but of ignorance, ineptitude and a failure in communications. Ignorance on the part of those charged at all levels with the siting, control and daily management of tips; bungling ineptitude on the part of those who had the duty of supervising and directing them; and failure on the part of those having knowledge of the factors which affect tip safety to communicate that knowledge and to see that it was applied” (bullet 18., page 13)
1966-67 (553) Report of the tribunal appointed to inquire into the disaster at Aberfan on October 21st, 1966
If you were to think about ranking the most important Figures from the IPCC Fifth Assessment Report, I would not be surprised if the following one (SPM.10) did not emerge as a strong candidate for the number one slot:
This is how the Figure appears in the main report, on page 28 (in the Summary for Policymakers) of The Physical Basis Report (see References: IPCC, 2013). The Synthesis Report includes a similar figure with additional annotations.
Many have used it in talks because of its fundamental importance (for example, Sir David King in his Walker Institute Annual Lecture (10th June 2015), ahead of COP21 in Paris). I have followed this lead, and am sure that I am not alone.
This Figure shows an approximately linear1 relationship between the cumulative carbon dioxide we emit2, and the rise in global average surface temperature3 up to 2100. It was crucial to discussions on carbon budgets held in Paris and the goal of stabilising the climate.
I am not proposing animating this Figure in the way discussed in my previous essay, but I do think its importance warrants additional attention to get it out there to a wider audience (beyond the usual climate geeks!).
So my question is:
“Does it warrant some kind of pedagogic treatment for a general audience (and dare I say, for policy-makers who may themselves struggle with the density of information conveyed)?”
My answer is yes, and I believe that the IPCC, as guardians of the integrity of the report findings, are best placed to lead such an effort, albeit supported by skills to support the science communications.
The IPCC should not leave it to bloggers and other commentators to furnish such content, as key Figures such as this are fundamental to the report’s findings, and need to be as widely understood as possible.
While I am conscious of Tufte’s wariness regarding Powerpoint, I think that the ‘build’ technique – when used well – can be extremely useful in unfolding the information, in biteable chunks. This is what I have tried to do with the above Figure in a recent talk. I thought I would share my draft attempt.
It can obviously do with more work, and the annotations represent my emphasis and use of language4. Nevertheless, I believe I was able to truthfully convey the key information from the original IPCC Figure more successfully than I have before; taking the audience with me, rather than scaring them off.
So here goes, taken from a segment of my talk … my narrative, to accompany the ‘builds’, is in italics …
Where are we now?
“There is a key question: what is the relationship between the peak atmospheric concentration and the level of warming, compared to a late 19th century baseline, that will result, by the end of the 21st century?”
“Let’s start with seeing where we are now, which is marked by a X in the Figure below.”
“Our cumulative man-made emissions of carbon dioxide (CO2) have to date been nearly 2000 billion tonnes (top scale above)”
“After noting that 50% of this remains in the atmosphere, this has given rise to an increase in the atmospheric concentration from its long-standing pre-industrial value of 280 parts per million to it current value which is now about 400 parts per million (bottom scale above).”
“This in turn has led to an increase in averaged global surface temperature of 1oC above the baseline of 1861 to 1880 (vertical scale above).”
Where might we be in 2100?
“As we add additional carbon dioxide, the temperature will rise broadly in proportion to the increased concentration in the atmosphere. There is some uncertainty between “best case” and “worst case” margins of error (shown by the dashed lines).”
“By the end of the century, depending on how much we emit and allowing for uncertainties, we can end up anywhere within the grey area shown here. The question marks (“?”) illustrate where we might be by 2100.”
Can we stay below 2C?
“The most optimistic scenario included in the IPCC’s Fifth Assessment Report (AR5) was based on the assumption of a rapid reduction in emissions, and a growing role for the artificial capture of carbon dioxide from the atmosphere (using a technology called BECCS).”
“This optimistic scenario would meet the target agreed by the nations in Paris, which is to limit the temperature rise to 2oC.”
“We effectively have a ‘carbon budget’; an amount of fossil fuels that can be burned and for us to stay below 2oC”.
“The longer we delay dramatically reducing emissions, the faster the drop would need to be in our emissions later, as we approach the end of the ‘carbon budget’.”
“Some argue that we are already beyond the point where we can realistically move fast enough to make this transition.”
“Generally, experts agree it is extremely challenging, but still not impossible.”
Where will we be in 2100? – Paris Commitments
“The nationally determined contributions (or NDCs) – the amounts by which carbon dioxide emissions will fall – that the parties to the Paris Agreement put forward have been totted up and they would, if implemented fully, bring us to a temperature rise of between 2.5 and 3.5 oC (and an atmospheric concentration about twice that of pre-industrial levels).”
“Now, the nations are committed to increase their ‘ambition’, so we expect that NDCs should get better, but it is deeply concerning that at present, the nations’ current targets are (1) not keeping us unambiguously clear of catastrophe, and (2) struggling to be met. More ambition, and crucially more achievement, is urgent.”
“I have indicated the orange scenarios as “globally severe”, but for many regions “catastrophic” (but some, for example, Xu and Ramanathan5, would use the term “Catastrophic” for any warming over 3oC, and “Unknown” for warming above 5oC). The IPCC are much more conservative in the language they use.”
Where will we be in 2100? – Business As Usual Scenario
“The so-called ‘business as usual’ scenario represents on-going use of fossil fuels, continuing to meet the majority of our energy needs, in a world with an increasing population and increasing GDP per capita, and consequently a continuing growth in CO2 emissions.”
”This takes global warming to an exceptionally bad place, with a (globally averaged) temperature rise of between 4 and 6 oC; where atmospheric concentrations will have risen to between 2.5 and 3 times the pre-industrial levels.”
“The red indicates that this is globally catastrophic.”
“If we go above 5oC warming we move, according to Xu and Ramanathan, from a “catastrophic” regime to an “unknown” one. I have not tried to indicate this extended vocabulary on the diagram, but what is clear is that the ‘business as usual’ scenario is really not an option, if we are paying attention to what the science is telling us.”
That’s it. My draft attempt to convey the substance and importance of Figure SPM.10, which I have tried to do faithfully; albeit adding the adjectives “optimistic” etc. to characterise the scenarios.
I am sure the IPCC could do a much better job than me at providing a more accessible presentation of Figure SPM.10 and indeed, a number of high ranking Figures from their reports, that deserve and need a broader audience.
The linearity of this relationship was originally discussed in Myles Allen et al (2009), and this and other work has been incorporated in the IPCC reports. Also see Technical Note A below.
About half of which remains in the atmosphere, for a very long time
Eventually, after the planet reaches a new equilibrium, a long time in the future. Also see Technical Note B below.
There are different opinions are what language to use – ‘dangerous’, ‘catastrophic’, etc. – and at what levels of warming to apply this language. The IPCC is conservative in its use of language, as is customary in the scientific literature. Some would argue that in wanting to avoid the charge of being alarmist, it is in danger of obscuring the seriousness of the risks faced. In my graphics I have tried to remain reasonably conservative in the use of language, because I believe things are serious enough; even when a conservative approach is taken.
In a recent paper in the Proceedings of the National Academy of Sciences, two climate scientists—Yangyang Xu, of Texas A. & M., and Veerabhadran Ramanathan, of the Scripps Institution of Oceanography—proposed that warming greater than three degrees Celsius be designated as “catastrophic” and warming greater than five degrees as “unknown??” The “unknown??” designation, they wrote, comes “with the understanding that changes of this magnitude, not experienced in the last 20+ million years, pose existential threats to a majority of the population.”
References
IPCC, 2013: Climate Change 2013: The Physical Science Basis. Contribution of Working Group I to the Fifth Assessment Report of the Intergovern- mental Panel on Climate Change [Stocker, T.F., D. Qin, G.-K. Plattner, M. Tignor, S.K. Allen, J. Boschung, A. Nauels, Y. Xia, V. Bex and P.M. Midgley (eds.)]. Cambridge University Press, Cambridge, United Kingdom and New York, NY, USA, 1535 pp.
IPCC, 2001: Climate Change 2001: The Scientific Basis. Contribution of Working Group I to the Third Assessment Report of the Intergovernmental Panel on Climate Change [Houghton, J.T., Y. Ding, D.J. Griggs, M. Noguer, P.J. van der Linden, X. Dai, K. Maskell, and C.A. Johnson (eds.)]. Cambridge University Press, Cambridge, United Kingdom and New York, NY, USA, 881pp.
Myles Allen at al (2009), “Warming caused by cumulative carbon emissions towards the trillionth tonne”,Nature 458, 1163-1166
Kirsten Zickfeld et al (2016), “On the proportionality between global temperature change and cumulative CO2 emissions during periods of net negative CO2 emissions”, Environ. Res. Lett. 11 055006
Technical Notes
A. Logarithmic relationship?
For those who know about the logarithmic relationship between added CO2 concentration and the ‘radiative forcing’ (giving rise to warming) – and many well meaning contrarians seem to take succour from this fact – the linear relationship in this figure may at first sight seem surprising.
The relative warming (between one level of emissions and another) is related to the ratio of this logarithmic function, and that is approximately linear over the concentration range of interest.
In any case, it is worth noting that CO2 concentrations have been increasing exponentially, and a logarithm of an exponential function is a linear function.
There is on-going work on wider questions. For example, to what extent ‘negative emissions technology’ can counteract warming that is in the pipeline?
Kirsten Zickfield et al (2016), is one such paper, “…[suggests that] positive CO2 emissions are more effective at warming than negative emissions are at subsequently cooling”. So we need to be very careful in assuming we can reverse warming that is in the pipeline.
B. Transient Climate Response and Additional Warming Commitment
The ‘Transient Climate Response’ (TCR) reflects the warming that results when CO2 is added at 1% per year, which for a doubling of the concentration takes 70 years. This is illustrated quite well in a figure from a previous report (Reference: IPCC, 2001):
The warming that results from this additional concentration of CO2 occurs over the same time frame. However, this does not include all the the warming that will eventually result because the earth system (principally the oceans and atmosphere) will take a long time to reach a new equilibrium where all the flows of energy are brought back into a (new) balance. This will take at least 200 years (for lower emission scenarios) or much longer for higher emission levels. This additional warming commitment must be added to the TCR. However, the TCR nevertheless does represent perhaps 70% of the overall warming, and remains a useful measure when discussing policy options over the 21st Century.
This discussion excludes more uncertain and much longer term feedbacks involving, for example, changes to the polar ice sheets (and consequentially, the Earth’s albedo), release of methane from northern latitudes or methane clathrates from the oceans. These are not part of the ‘additional warming commitment’, even in the IPCC 2013 report, as they are considered too speculative and uncertain to be quantified.
The IPCC (Intergovernmental Panel on Climate Change) is exploring ways to improve the communication of its findings, particularly to a more general audience. They are not alone in having identified a need to think again about clear ‘science communications’. For example, the EU’s HELIX project (High-End Climate Impacts and Extremes), produced some guidelines a while ago on better use of language and diagrams.
The idea is not to say ‘communicate like THIS’ but more to share good practice amongst scientists and to ensure all scientists are aware of the communication issues, and then to address them.
Much of this guidance concerns the ‘soft’ aspects of communication: how the communicator views themself; understanding the audience; building trust; coping with uncertainty; etc.
Some of this reflects ideas that are useful not just to scientific communication, but almost any technical presentation in any sector, but that does not diminish its importance.
This has now been distilled into a Communications Handbook for IPCC Scientists; not an official publication of the IPCC but a contribution to the conversation on how to improve communications.
I want to take a slightly different tack, which is not a response to the handbook per se, but covers a complementary issue.
In many years of being involved in presenting complex material (in my case, in enterprise information management) to audiences unfamiliar with the subject at hand, I have often been aware of the communication potential but also risks of diagrams. They say that a picture is worth a thousand words, but this is not true if you need a thousand words to explain the picture!
The unwritten rules related to the visual syntax and semantics of diagrams is a fascinating topic, and one which many – and most notably Edward Tufte – have explored. In chapter 2 of his insightful and beautiful book Visual Explanations, Tufte argues:
“When we reason about quantityative evidence, certain methods for displaying and analysing data are better than others. Superior methods are more likely to produce truthful, credible, and precise findings. The difference between an excellent analysis and a faulty one can sometimes have momentous consequences”
He then describes how data can be used and abused. He illustrates this with two examples: the 1854 Cholera epidemic in London and the 1986 Challenger space shuttle disaster.
Tufte has been highly critical of the over reliance on Powerpoint for technical reporting (not just presentations) in NASA, because the form of the content degrades the narrative that should have been an essential part of any report (with or without pictures). Bulletized data can destroy context, clarity and meaning.
There could be no more ‘momentous consequences’ than those that arise from man-made global warming, and therefore, there could hardly be a more important case where a Tuftian eye, if I may call it that, needs to be brought to bear on how the information is described and visualised.
The IPCC, and the underlying science on which it relies, is arguably the greatest scientific collaboration ever undertaken, and rightly recognised with a Nobel Prize. It includes a level of interdisciplinary cooperation that is frankly awe-inspiring; unique in its scope and depth.
It is not surprising therefore that it has led to very large and dense reports, covering the many areas that are unavoidably involved: the cryosphere, sea-level rise, crops, extreme weather, species migration, etc.. It might seem difficult to condense this material without loss of important information. For example, Volume 1 of the IPCC Fifth Assessment Report, which covered the Physical Basis of Climate Change, was over 1500 pages long.
Nevertheless, the IPCC endeavours to help policy-makers by providing them with summaries and also a synthesis report, to provide the essential underlying knowledge that policy-makers need to inform their discussions on actions in response to the science.
However, in its summary reports the IPCC will often reuse key diagrams, taken from the full reports. There are good reasons for this, because the IPCC is trying to maintain mutual consistency between different products covering the same findings at different levels of detail.
This exercise is fraught with risks of over-simplification or misrepresentation of the main report’s findings, and this might limit the degree to which the IPCC can become ‘creative’ with compelling visuals that ‘simplify’ the original diagrams. Remember too that these reports need to be agreed by reviewers from national representatives, and the language will often seem to combine the cautiousness of a scientist with the dryness of a lawyer.
So yes, it can be problematic to use artistic flair to improve the comprehensibility of the findings, but risk losing the nuance and caution that is a hallmark of science. The countervailing risk is that people do not really ‘get it’; and do not appreciate what they are seeing.
We have seen with the Challenger reports, that people did not appreciate the issue with the O rings, especially when key facts were buried in 5 levels of indented bullet points in a tiny font, for example or, hidden in plain sight, in a figure so complex that the key findings are lost in a fog of complexity.
That is why any attempt to improve the summaries for policy makers and the general public must continue to involve those who are responsible for the overall integrity and consistency of the different products, not simply hived off to a separate group of ‘creatives’ who would lack knowledge and insight of the nuance that needs to be respected. But those complementary skills – data visualizers, graphics artists, and others – need to be included in this effort to improve science communications. There is also a need for those able to critically evaluate the pedagogic value of the output (along the lines of Tufte), to ensure they really inform, and do not confuse.
Some individuals have taken to social media to present their own examples of how to present information, which often employs animation (something that is clearly not possible for the printed page, or its digital analogue, a PDF document). Perhaps the most well known example to date was Professor Ed Hawkin’s spiral picture showing the increase in global mean surface temperature:
There are now a number of other great producers of animations. Here follows a few examples.
Here, Kevin Pluck (@kevpluck) illustrates the link between the rising carbon dioxide levels and the rising mean surface temperature, since 1958 (the year when direct and continuous measurements of carbon dioxide were pioneered by Keeling)
Kevin Pluck has many other animations which are informative, particularly in relation to sea ice.
Another example, from Antti Lipponen (@anttilip), visualises the increase in surface warming from 1900 to 2017, by country, grouped according to continent. We see the increasing length/redness of the radial bars, showing an overall warming trend, but at different rates according to region and country.
A final example along the same lines is from John Kennedy (@micefearboggis), which is slightly more elaborate but rich in interesting information. It shows temperature changes over the years, at different latitudes, for both ocean (left side) and land (right side). The longer/redder the bar the higher the increase in temperature at that location, relative to the temperature baseline at that location (which scientists call the ‘anomaly’). This is why we see the greatest warming in the Arctic, as it is warming proportionally faster than the rest of the planet; this is one of the big takeaways from this animation.
These examples of animation are clearly not dumbing down the data, far from it. They improve the chances of the general public engaging with the data. This kind of animation of the data provides an entry point for those wanting to learn more. They can then move onto a narrative treatment, placing the animation in context, confident that they have grasped the essential information.
If the IPCC restricts itself to static media (i.e. PDF files), it will miss many opportunities to enliven the data in the ways illustrated above that reveal the essential knowledge that needs to be communicated.